
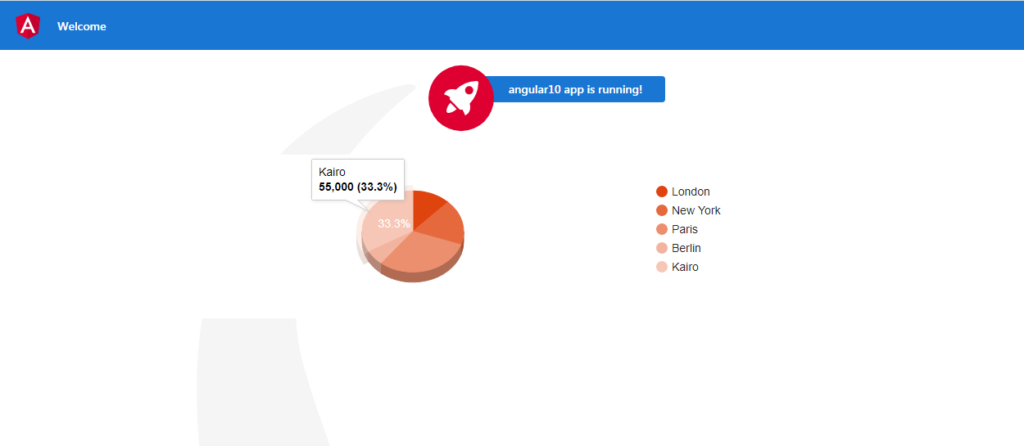
Hello to all, welcome to therichpost.com. In this post, i will tell you, Angular 10 Google Charts with PHP Json Data.
Here is the code snippet and please follow carefully:
1. Very first, here are common basics steps to add angular 10 application on your machine:
npm install -g @angular/cli

ng new angularcharts // Set Angular10 Application on your pc

cd angularcharts // Go inside project folder

ng serve // Run project

http://localhost:4200/  //Check working Local server
2. Now run below command into your terminal to include google chart package into your angular 10 application:
npm install angular-google-charts
3. Now add below code into your app.module.ts file:
import { GoogleChartsModule } from 'angular-google-charts';
import { HttpClientModule } from '@angular/common/http';
   imports: [
    ...
    GoogleChartsModule.forRoot(),
    HttpClientModule
  ]
4. Now add below code into your app.component.ts file:
...
import { HttpClient } from '@angular/common/http';
export class AppComponent {
...
  //Declare variable to store API values
  cartkey = [];
  myType:any;
  myData:any;
  myOptions:any;

  constructor(private http: HttpClient) {

  this.http.get('http://localhost/mypage.php').subscribe(data => {
  //Convert json to array
  this.cartkey = data.map(function(item, keys) {
  //Merge array
  var mixarrayy = Object.keys(item).concat(Object.values(item));
  return mixarrayy;

  });
  setTimeout(() => {
  this.myType = 'PieChart';
  this.myData = this.cartkey;
  this.myOptions = {
  colors: ['#e0440e', '#e6693e', '#ec8f6e', '#f3b49f', '#f6c7b6'],
  is3D: true
  };
  }, 2500);

  });
  }
}
5. Finally add, below code into your app.component.html file:
<google-chart style="width:100%;" [type]="myType" [data]="myData" [options]="myOptions" ></google-chart>
6. Here is the mypage.php file code:
<?php
header("Access-Control-Allow-Origin: *");
header("Access-Control-Allow-Methods: PUT, GET, POST");
header("Access-Control-Allow-Headers: Origin, X-Requested-With, Content-Type, Accept");

//Custom json
$chartdata = array(
array("London" => 20000),
array("New York" => 30000),
array("Paris" => 50000),
array("Berlin" => 10000),
array("Kairo" => 55000),
);
echo json_encode($chartdata);

?>
This is it and if you have any kind of query then please watch the above video or do comment below.
Jassa
Thanks
Leave a Reply
You must be logged in to post a comment.