Angular 8 Google Charts working example

angular 8 google charts

Hello to all, welcome again on therichpost.com. In this post, I will tell you, Angular 8 Google Charts working example.

Post Working:

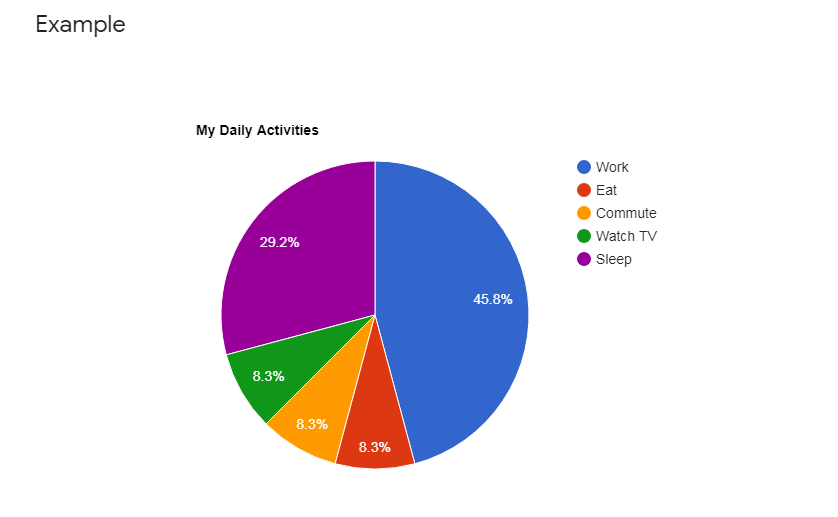
In this post, I am showing google pie chart in Angular 8.
angular 8 google charts

Here is the working code snippet and please follow carefully:

1. Very first, here are common basics steps to add angular 8 application on your machine:

$ npm install -g @angular/cli

$ ng new angularcharts // Set Angular8 Application on your pc

cd angularcharts // Go inside project folder

ng serve // Run project

http://localhost:4200/  //Check working Local server


2. Now run below command into your terminal to include google chart package into your angular 8 application:

npm install angular-google-charts


3. Now add below code into your app.module.ts file:

import { GoogleChartsModule } from 'angular-google-charts';

   imports: [
    ...
    GoogleChartsModule.forRoot(),
  ]


4. Now add below code into your app.component.ts file:

myType = 'PieChart';
myData = [
    ['London', 8136000],
    ['New York', 8538000],
    ['Paris', 2244000],
    ['Berlin', 3470000],
    ['Kairo', 19500000]
  ];


5. Finally add, below code into your app.component.html file:

<google-chart [type]="myType" [data]="myData" ></google-chart>


This is it and if you have any kind of query then please let me know.

Jas

Thank you

Comments

29 responses to “Angular 8 Google Charts working example”

  1. Cameron Avatar
    Cameron

    Hi Ajay, Thanks for the tutorial. How do we reference the chart again, say on a mouse move event? In JS there is something like var chart = new google.visualization.PieChart(document.getElementById(‘chart_div’)) but how do we do this in Angular 8.

  2. Ajay Malhotra Avatar

    You want use mouse move event?

  3. Cameron Crum Avatar
    Cameron Crum

    Yes. I need a mouse move on the chart so I can get the value of the X axis where the tooltip is.

  4. Ajay Malhotra Avatar

    yes and I will update this.

  5. sameer Avatar
    sameer

    hi ajay i need to display data from from rest response in google chart can you help ?

  6. Ajay Malhotra Avatar

    Hello sameer, you want to show dynamic API data?

  7. Osmar Avatar
    Osmar

    Works like a charm, thank you so much!!

  8. Ajay Malhotra Avatar

    You are welcome

  9. sameer Avatar
    sameer

    yes i want to show dynamic data as soon as i click button i should change data in graph

  10. Ajay Malhotra Avatar

    Yes, I will make video tutorial on it.

  11. Shaninath Avatar
    Shaninath

    Hi Ajay , What if I want show multiple charts on one page like say 3 to 4 different charts with different data how can we do that

  12. Ajay Malhotra Avatar

    You just need to different id’s and I will update the post with that.

    Thank you

  13. Shagun Avatar
    Shagun

    Hi Ajay, I want to display data retrieved from DB through rest api and in different types of charts. How can i do that. Can you update on this please.

  14. Namit Jain Avatar
    Namit Jain

    Hi Ajay,
    I need to make a google chart using Angular 9 and want to use the data in my database hosted on Amazon RDS. And the data should be fetched using PHP. Can you help me?

  15. Ajay Malhotra Avatar

    Hi, I have made post on it and publish at night and also made video on it.

    Thanks

  16. Mohit Avatar
    Mohit

    Any idea how to use google.visualization.events.addListener() with your tutorial ? Thanks in advance

  17. Ajay Malhotra Avatar

    Yes and I will share soon.
    Thanks

  18. JuliaPeao Avatar
    JuliaPeao

    Hi Ajay, can you take a look at my code and help me? I am using data from mysql for the chart? The function map seems to break. It works for a day and then the whole app crashes. I can add my code here?

  19. Ajay Malhotra Avatar
  20. Ishan Tewari Avatar
    Ishan Tewari

    Ok.. I am sending you my code in email. Please have a look.

  21. Vikas adhikari Avatar
    Vikas adhikari

    TypeError: Cannot read property ‘loadChartPackages’ of undefined at GoogleChartComponent.ngOnInit…..
    I am getting this error on angular 8. Please help

  22. Ajay Malhotra Avatar

    okay, I will update you. Thanks

  23. Nitish Dhiamn Avatar
    Nitish Dhiamn

    AppComponent.html:5 ERROR TypeError: Cannot read property ‘ngMetadataName’ of undefined at injectArgs.
    I’m having this error can anyone help me plz..
    i’m using angular cli 8.0.3

  24. Ajay Malhotra Avatar

    Where you have “‘ngMetadataName’ of undefined at injectArgs” used this?

  25. Abhinaw Tiwari Avatar
    Abhinaw Tiwari

    node_modules/angular-google-charts/lib/components/google-chart/google-chart.component.d.ts(85,9): error TS1086: An accessor cannot be declared in an ambient context.

    I am getting this error. Can you help?

  26. Ajay Malhotra Avatar

    Setting “skipLibCheck”: true in tsconfig.json will solve your problem.

    “compilerOptions”: {
    “skipLibCheck”: true
    }