
Hello to all, welcome to therichpost.com. In this post, I will tell you, How to add Chart js Datatables Fullcalendar in Angular single Component?
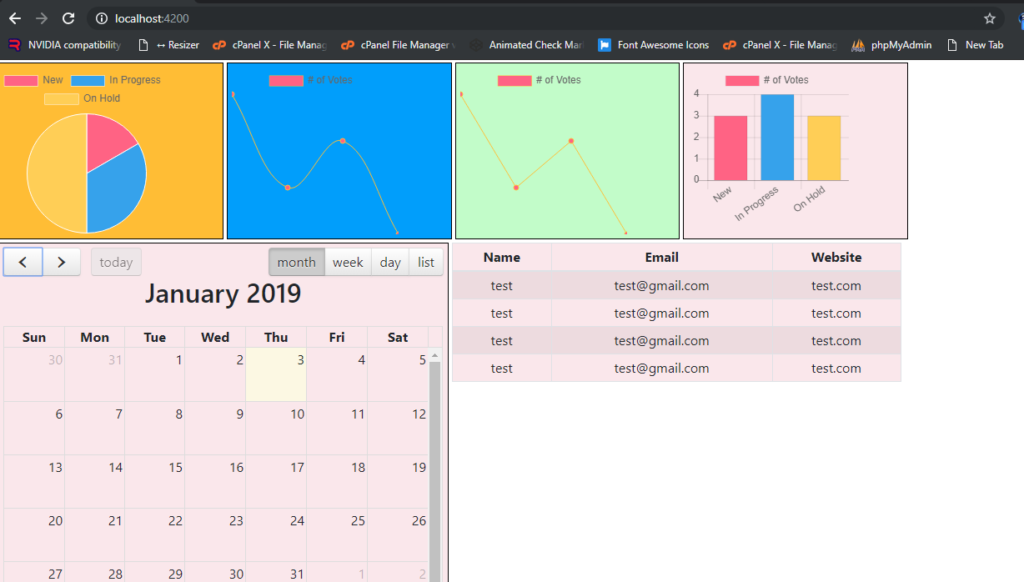
Angular 7 is getting more popularity day by day and we will include Chartjs, Datatables and Fullcalendar in Angular 7 and this is the best. Here I am showing the working example picture:
Here are the coding snippets, you need to follow:
1. Very first, you need to run common below commands to add Angular 7 project on your machine:
$ npm install -g @angular/cli
$ ng new chartjsangular //Install Angular Project
$ cd chartjsangular // Go to project folder
$ ng serve //Run Project
http://localhost:4200/ //Run On local server
2. Now you need to run below commands to add chart js into your Angular application:
$ npm install --save chart.js

$ npm install ng-fullcalendar --save

$ npm install angular-datatables --save

$ npm install datatables.net --save

$ npm install datatables.net-dt --save

$ npm install @types/jquery --save-dev

$ npm install @types/datatables.net --save-dev

$ npm install ngx-bootstrap bootstrap --save
3. After that, add below code into your angular.json file:
....
 "styles": [
   "src/styles.css",
   "node_modules/datatables.net-dt/css/jquery.dataTables.css",
   "node_modules/bootstrap/dist/css/bootstrap.min.css",
  ],
"scripts": [
  "node_modules/datatables.net/js/jquery.dataTables.js",
  "node_modules/bootstrap/dist/js/bootstrap.js",]
....
4. After that, add below code into your app.module.ts file:
import { BrowserModule } from '@angular/platform-browser';
import { NgModule } from '@angular/core';
import { FullCalendarModule } from 'ng-fullcalendar';
import { AppComponent } from './app.component';
import {DataTablesModule} from 'angular-datatables';

@NgModule({
  declarations: [
    AppComponent
  ],
  imports: [
    BrowserModule,
    FullCalendarModule,
    DataTablesModule
  ],
  providers: [],
  bootstrap: [AppComponent]
})
export class AppModule { }
5. After that, add below code into your app.component.ts file:
import { Component, AfterViewInit } from '@angular/core';
import * as Chart from 'chart.js';
import { Options } from 'fullcalendar';
@Component({
  selector: 'app-root',
  templateUrl: './app.component.html',
  styleUrls: ['./app.component.css']
})
export class AppComponent {
  title = 'chartjsangular';
  canvas  : any;
  ctx     : any;

  canvas1 : any;
  ctx1    : any;

  canvas2 : any;
  ctx2    : any;

  canvas3 : any;
  ctx3    : any;

  calendarOptions: Options;

  public data = [
    {name: 'test', email: 'test@gmail.com', website:'test.com'},
    {name: 'test', email: 'test@gmail.com', website:'test.com'},
    {name: 'test', email: 'test@gmail.com', website:'test.com'},
    {name: 'test', email: 'test@gmail.com', website:'test.com'},
  ];
  dtOptions: DataTables.Settings = {};
  ngOnInit() {

    this.canvas = document.getElementById('myChart');
    this.ctx = this.canvas.getContext('2d');

    let myChart = new Chart(this.ctx, {
      type: 'pie',
      data: {
          labels: ["New", "In Progress", "On Hold"],
          datasets: [{
              label: '# of Votes',
              data: [1,2,3],
              backgroundColor: [
                  'rgba(255, 99, 132, 1)',
                  'rgba(54, 162, 235, 1)',
                  'rgba(255, 206, 86, 1)'
              ],
              borderWidth: 1
          }]
      },
      options: {
        responsive: false,
        display:true
      }
    });

    this.canvas1 = document.getElementById('myChart1');
    this.ctx1 = this.canvas1.getContext('2d');

    let myChart1 = new Chart(this.ctx1, {
      type: 'line',
      data: {
          labels: ['January', 'February', 'March', 'April'],
          datasets: [{
              label: '# of Votes',
              fill: false,
              data: [5,3,4,2],
              backgroundColor: [
                  'rgba(255, 99, 132, 1)',
                  'rgba(54, 162, 235, 1)',
                  'rgba(255, 206, 86, 1)'
              ],
              borderColor: "#ffbd35",
              borderWidth: 1
          }]
      },
      options: {
        responsive: false,
        display:true,
        scales: { yAxes: [{ display: false }],xAxes: [{
                display: false //this will remove all the x-axis grid lines
            }] }
      },


    });

    this.canvas2 = document.getElementById('myChart2');
    this.ctx2 = this.canvas2.getContext('2d');

    let myChart2 = new Chart(this.ctx2, {
      type: 'line',
      data: {
          labels: ['January', 'February', 'March', 'April'],
          datasets: [{
              label: '# of Votes',
              fill: false,
              data: [5,3,4,2],
              backgroundColor: [
                  'rgba(255, 99, 132, 1)',
                  'rgba(54, 162, 235, 1)',
                  'rgba(255, 206, 86, 1)'
              ],
              borderColor: "#ffbd35",
              borderWidth: 1
          }]
      },
      options: {
        responsive: false,
        display:true,
        scales: { yAxes: [{ display: false }],xAxes: [{
                display: false //this will remove all the x-axis grid lines
            }] },
        elements: {
        line: {
          tension: 0.000001
        }
    },
      },


    });


    this.canvas3 = document.getElementById('myChart3');
    this.ctx3 = this.canvas3.getContext('2d');

     let myChart3 = new Chart(this.ctx3, {
      type: 'bar',
      data: {
          labels: ["New", "In Progress", "On Hold"],
          datasets: [{
              label: '# of Votes',
              data: [3,4,3],
              backgroundColor: [
                  'rgba(255, 99, 132, 1)',
                  'rgba(54, 162, 235, 1)',
                  'rgba(255, 206, 86, 1)'
              ],
              borderWidth: 1
          }]
      },
      options: {
        responsive: false,
        display:true,
        scales: {
        yAxes: [{
            ticks: {
                beginAtZero:true
            }
        }]
    }
      }
    });

     this.calendarOptions = {
        editable: true,
        eventLimit: false,
        header: {
          left: 'prev,next today',
          center: 'title',
          right: 'month,agendaWeek,agendaDay,listMonth'
        }

      };

      this.dtOptions = {
      pagingType: 'full_numbers',
      pageLength: 5,
      processing: true
    };
  }

}
6. Finally add below code into your app.component.html file:
<link rel="stylesheet" href="https://cdnjs.cloudflare.com/ajax/libs/fullcalendar/3.6.1/fullcalendar.min.css">
<div style="text-align:center; width: 100%;">
  <h1>
    {{ title }}!
  </h1>
  <div style="float: left;width: 20%;border: 1px solid #000;margin: 2px; padding: 5px;background: #ffbd35">
   <canvas id="myChart" width="200" height="200"></canvas>
  </div>

   <div style="float: left;width: 20%;border: 1px solid #000;border: 1px solid #000;margin: 2px; padding: 5px;background: #019efb">
    <canvas id="myChart1" width="200" height="200"></canvas>
   </div>

   <div style="float: left;width: 20%;border: 1px solid #000;border: 1px solid #000;margin: 2px; padding: 5px;background: #c2fcc9">
    <canvas id="myChart2" width="200" height="200"></canvas>
   </div>

   <div style="float: left;width: 20%;border: 1px solid #000;border: 1px solid #000;margin: 2px; padding: 5px;background: #fae7eb">
    <canvas id="myChart3" width="200" height="200"></canvas>
   </div>

   <div *ngIf="calendarOptions" style="float: left;width: 40%;border: 1px solid #000;border: 1px solid #000;margin: 2px; padding: 5px;background: #fae7eb">
    <ng-fullcalendar #ucCalendar [options]="calendarOptions" (eventClick)="eventClick($event.detail)" (eventDrop)="updateEvent($event.detail)"
        (eventResize)="updateEvent($event.detail)" (clickButton)="clickButton($event.detail)"></ng-fullcalendar>
  </div>

  <table style="float: left;width: 40%;border: 1px solid #000;border: 1px solid #000;margin: 2px; padding: 5px;background: #fae7eb" class="table table-striped table-bordered table-sm row-border hover" datatable [dtOptions]="dtOptions">
  <thead>
    <tr>
      <th>Name</th>
      <th>Email</th>
      <th>Website</th>
    </tr>
  </thead>
  <tbody>
   <tr *ngFor="let group of data">
         <td>{{group.name}}</td>
         <td>{{group.email}}</td>
         <td>{{group.website}}</td>
     </tr>
  </tbody>
</table>

</div>
This is it and in the end, run ng serve command into your terminal and see the output like above image and if you have any query related to this post then please do comment below or ask question.
Thank you
Ludhiane wala ajay
TheRichPost
Leave a Reply
You must be logged in to post a comment.