
Hello to all, welcome to therichpost.com. In this post, I will tell you, How to show multiple Charts in one Component in Angular?
If you are new in Angular then you can check my old angular posts.
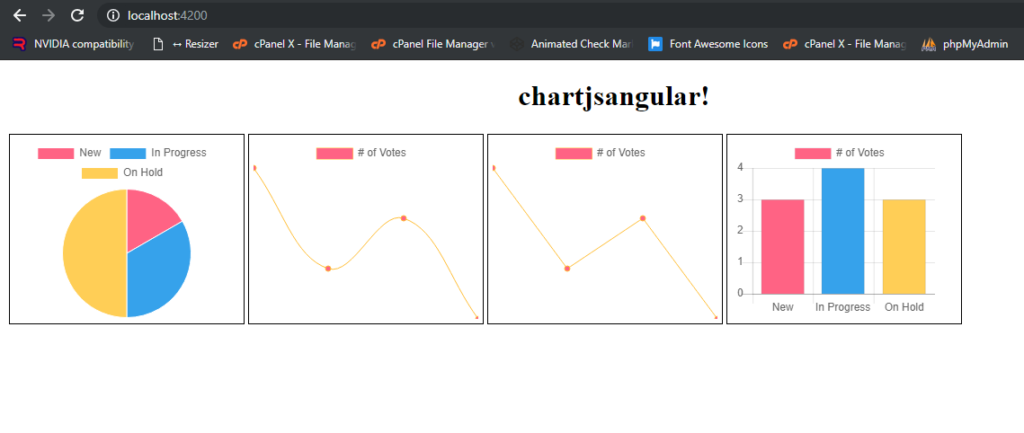
In this post, I will show multiple charts from chart js in one Angular component and here is the working example picture:
Here is the working code snippets need to follow:
1. Very first, you need to run common below commands to add Angular 7 project on your machine:
$ npm install -g @angular/cli
$ ng new chartjsangular //Install Angular Project
$ cd chartjsangular // Go to project folder
$ ng serve //Run Project
http://localhost:4200/ //Run On local server
2. Now you need to run below commands to add chart js into your Angular application:
npm install --save chart.js
3. After that, add below code into your app.component.ts file:
import { Component, AfterViewInit } from '@angular/core';
import * as Chart from 'chart.js';
@Component({
  selector: 'app-root',
  templateUrl: './app.component.html',
  styleUrls: ['./app.component.css']
})
export class AppComponent {
  title = 'chartjsangular';
  canvas  : any;
  ctx     : any;

  canvas1 : any;
  ctx1    : any;

  canvas2 : any;
  ctx2    : any;

  canvas3 : any;
  ctx3    : any;

  ngOnInit() {

    this.canvas = document.getElementById('myChart');
    this.ctx = this.canvas.getContext('2d');

    let myChart = new Chart(this.ctx, {
      type: 'pie',
      data: {
          labels: ["New", "In Progress", "On Hold"],
          datasets: [{
              label: '# of Votes',
              data: [1,2,3],
              backgroundColor: [
                  'rgba(255, 99, 132, 1)',
                  'rgba(54, 162, 235, 1)',
                  'rgba(255, 206, 86, 1)'
              ],
              borderWidth: 1
          }]
      },
      options: {
        responsive: false,
        display:true
      }
    });

    this.canvas1 = document.getElementById('myChart1');
    this.ctx1 = this.canvas1.getContext('2d');

    let myChart1 = new Chart(this.ctx1, {
      type: 'line',
      data: {
          labels: ['January', 'February', 'March', 'April'],
          datasets: [{
              label: '# of Votes',
              fill: false,
              data: [5,3,4,2],
              backgroundColor: [
                  'rgba(255, 99, 132, 1)',
                  'rgba(54, 162, 235, 1)',
                  'rgba(255, 206, 86, 1)'
              ],
              borderColor: "#ffbd35",
              borderWidth: 1
          }]
      },
      options: {
        responsive: false,
        display:true,
        scales: { yAxes: [{ display: false }],xAxes: [{
                display: false //this will remove all the x-axis grid lines
            }] }
      },


    });

    this.canvas2 = document.getElementById('myChart2');
    this.ctx2 = this.canvas2.getContext('2d');

    let myChart2 = new Chart(this.ctx2, {
      type: 'line',
      data: {
          labels: ['January', 'February', 'March', 'April'],
          datasets: [{
              label: '# of Votes',
              fill: false,
              data: [5,3,4,2],
              backgroundColor: [
                  'rgba(255, 99, 132, 1)',
                  'rgba(54, 162, 235, 1)',
                  'rgba(255, 206, 86, 1)'
              ],
              borderColor: "#ffbd35",
              borderWidth: 1
          }]
      },
      options: {
        responsive: false,
        display:true,
        scales: { yAxes: [{ display: false }],xAxes: [{
                display: false //this will remove all the x-axis grid lines
            }] },
        elements: {
        line: {
          tension: 0.000001
        }
    },
      },


    });


    this.canvas3 = document.getElementById('myChart3');
    this.ctx3 = this.canvas3.getContext('2d');

     let myChart3 = new Chart(this.ctx3, {
      type: 'bar',
      data: {
          labels: ["New", "In Progress", "On Hold"],
          datasets: [{
              label: '# of Votes',
              data: [3,4,3],
              backgroundColor: [
                  'rgba(255, 99, 132, 1)',
                  'rgba(54, 162, 235, 1)',
                  'rgba(255, 206, 86, 1)'
              ],
              borderWidth: 1
          }]
      },
      options: {
        responsive: false,
        display:true,
        scales: {
        yAxes: [{
            ticks: {
                beginAtZero:true
            }
        }]
    }
      }
    });
  }

}
4. Finally add below code into your app.component.html file:
<!--The content below is only a placeholder and can be replaced.-->
<div style="text-align:center">
  <h1>
    {{ title }}!
  </h1>
  <div style="float: left;width: 250px;border: 1px solid #000;margin: 2px; padding: 5px;">
   <canvas id="myChart" width="250" height="200"></canvas>
  </div>

   <div style="float: left;width: 250px;border: 1px solid #000;border: 1px solid #000;margin: 2px; padding: 5px;">
    <canvas id="myChart1" width="250" height="200"></canvas>
   </div>

   <div style="float: left;width: 250px;border: 1px solid #000;border: 1px solid #000;margin: 2px; padding: 5px;">
    <canvas id="myChart2" width="250" height="200"></canvas>
   </div>

   <div style="float: left;width: 250px;border: 1px solid #000;border: 1px solid #000;margin: 2px; padding: 5px;">
    <canvas id="myChart3" width="250" height="200"></canvas>
   </div>

</div>
This is it and in the end, run ng serve command into your terminal and see the output like above image and if you have any query related to this post then please do comment below or ask question.
Thank you
Ludhiane wala ajay
TheRichPost
Leave a Reply