
Hello to all, welcome to therichpost.com. In this post, I will tell you, Angular 13 Google Line Chart with Tooltip Working Example.
Angular13 came and if you are new then you must check below link:
Here is the code snippet and please use carefully:
1. Very first guys, here are common basics steps to add angular 13 application on your machine and also we must have latest nodejs version(14.17.0) installed for angular 13:
$ npm install -g @angular/cli

$ ng new angularcharts // Set Angular 13 Application on your pc

cd angularcharts // Go inside project folder
2. Now run below commands to set google chart modules into our angular 13 application:
npm install angular-google-charts
3. Now we will add below code into our angularcharts/src/app/app.module.ts file:
...
import { GoogleChartsModule } from 'angular-google-charts';
@NgModule({
  ..
  imports: [
   ...
    GoogleChartsModule
  ],
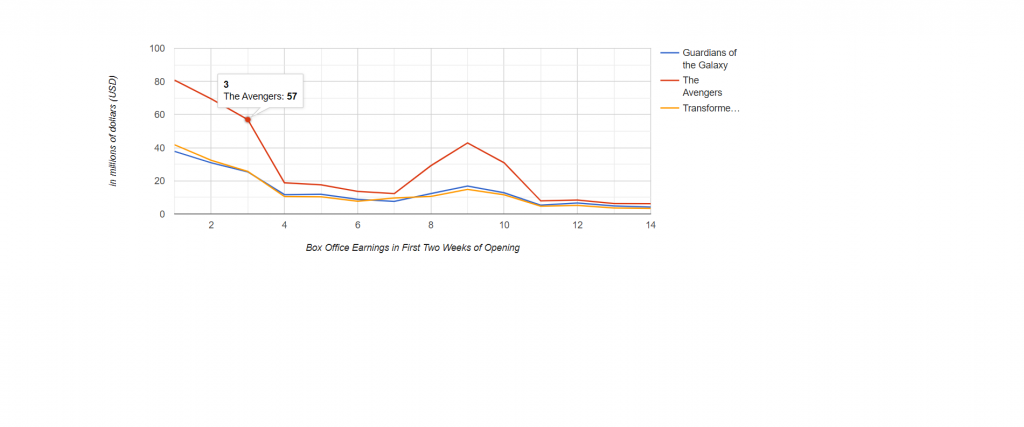
4. Now we will add below code into our angularcharts/src/app/app.component.ts file:
...
export class AppComponent {
...


//Line Chart

chartData:any = {
  type: 'LineChart',
  data: [
    [1, 37.8, 80.8, 41.8],
    [2, 30.9, 69.5, 32.4],
    [3, 25.4, 57, 25.7],
    [4, 11.7, 18.8, 10.5],
    [5, 11.9, 17.6, 10.4],
    [6, 8.8, 13.6, 7.7],
    [7, 7.6, 12.3, 9.6],
    [8, 12.3, 29.2, 10.6],
    [9, 16.9, 42.9, 14.8],
    [10, 12.8, 30.9, 11.6],
    [11, 5.3, 7.9, 4.7],
    [12, 6.6, 8.4, 5.2],
    [13, 4.8, 6.3, 3.6],
    [14, 4.2, 6.2, 3.4]

],
columnNames: ["Day", "Guardians of the Galaxy", "The Avengers", "Transformers: Age of Extinction"],
options: {
hAxis: {
     title: 'Box Office Earnings in First Two Weeks of Opening'
  },
  vAxis:{
     title: 'in millions of dollars (USD)'
  },
},
width: 1000,
height: 400
};

}
5. Finally we will add below code into our angularcharts/src/app/app.component.html file:
<google-chart
    [type]="chartData.type"
    [data]="chartData.data"
    [columns]="chartData.columnNames"
    [options]="chartData.options"
    [width]="chartData.width"
    [height]="chartData.height">

</google-chart>
Now we are done friends and please run ng serve command to check the output in browser(locahost:4200) and if you have any kind of query then please do comment below.
Note: Friends, I just tell the basic setup and things, you can change the code according to your requirements. For better understanding must watch video above.
I will appreciate that if you will tell your views for this post. Nothing matters if your views will be good or bad.
Jassa
Thanks
Leave a Reply