
Hello to all, welcome to therichpost.com. In this post, I will tell you, Angular 10 chart js working example and code.
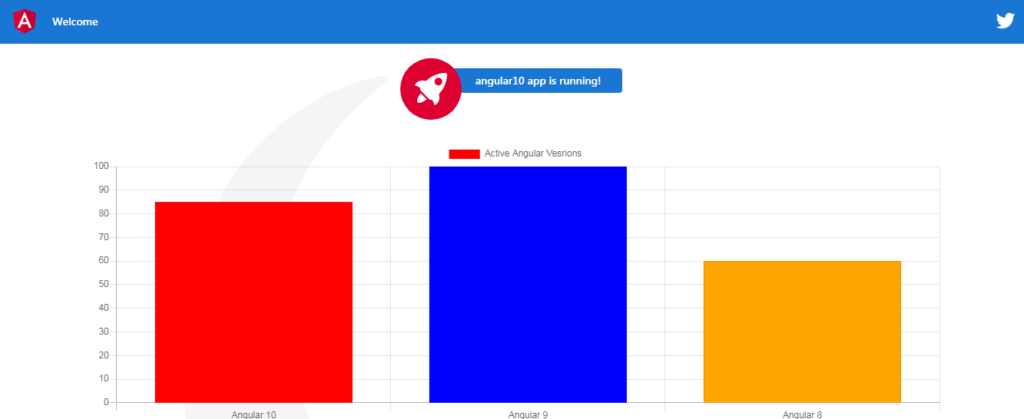
In this post, I am showing bar chart, line chart and pie chart and I have also used bootstrap for good looks.
Angular 10 came and if you are know in Angular 10 then please check my old videos.
Here is the chartjs working example in Angular 9: Angular 9 Chartjs
Hers is the chartjs working example in Angular 8: Angular 8 Chartjs
Here is the working code snippet and please use carefully:
1. Here are the basics commands, you need to use into your terminal or command prompt to install Angular 10 fresh set up:
$ npm install -g @angular/cli //Setup Angular10 atmosphere

$ ng new angular10chartjs //Install New Angular App

/**You need to update your Nodejs also for this verison**/

$ cd angular10chartjs //Go inside the Angular 10 Project
2. After Install Angular 10 fresh setup and go inside the Angular 10 setup, run below command into your terminal to install chartjs module and Bootstrap:
npm install --save chart.js
npm install bootstrap --save
3. After done with commands add below code into you angular.json file:
...
"styles": [
              ...
              "node_modules/bootstrap/dist/css/bootstrap.min.css",

            ],
            "scripts": [
           ...
            "node_modules/bootstrap/dist/js/bootstrap.js",

            ]
...
4. After all above setup, here is code, you need to add into your app.component.ts file:
...
import * as Chart from 'chart.js';

export class AppComponent {
canvas:any; ctx:any; canvas2:any; ctx2:any; canvas3:any; ctx3:any;
...
ngOnInit(){
...
this.canvas = document.getElementById('myChart');
this.canvas2 = document.getElementById('myChart2');
this.canvas3 = document.getElementById('myChart3');
this.ctx = this.canvas.getContext('2d');
this.ctx2 = this.canvas2.getContext('2d');
  this.ctx3 = this.canvas3.getContext('2d');
    let myChart = new Chart(this.ctx, {
      type: 'bar',
      data: {
          labels: ["Angular 10", "Angular 9", "Angular 8"],
          datasets: [{
              label: 'Active Angular Vesrions',
              data: [85, 100, 60],
              backgroundColor: ["red","blue", "orange"],
              borderWidth: 1
          }]
      },
      options: {
    legend: {
        display: true
    },
        responsive: true,
        display:true,
    scales: {
        yAxes: [{
            ticks: {
                beginAtZero: true
            }
        }]
    }
      }
    });

  let myChart2 = new Chart(this.ctx2, {
      type: 'pie',
      data: {
          labels: ["Angular 10", "Angular 9", "Angular 8"],
          datasets: [{
              label: 'Active Angular Vesrions',
              data: [85, 100, 60],
              backgroundColor: ["red","blue", "orange"],
              borderWidth: 1
          }]
      },
      options: {
    legend: {
        display: true
    },
        responsive: true,
        display:true,
    scales: {
        yAxes: [{
            ticks: {
                beginAtZero: true
            }
        }]
    }
      }
    });

  let myChart3 = new Chart(this.ctx3, {
      type: 'line',
      data: {
          labels: ["Angular 10", "Angular 9", "Angular 8"],
          datasets: [{
              label: 'Active Angular Vesrions',
              data: [85, 100, 60],
              backgroundColor: ["red","blue", "orange"],
              borderWidth: 1
          }]
      },
      options: {
    legend: {
        display: true
    },
        responsive: true,
        display:true,
    scales: {
        yAxes: [{
            ticks: {
                beginAtZero: true
            }
        }]
    }
      }
    });
}
}
5. Now add below code into your app.component.html file:
<div class="container mt-5 mb-5">

<canvas id="myChart" width="1200px" height="400"></canvas>

<canvas class="mt-5" id="myChart2" width="1200px" height="400"></canvas>

<canvas class="mt-5" id="myChart3" width="1200px" height="400"></canvas>
</div>
This is it and please run ng serve command in the end and if you have any kind of query then please do comment below.
Jassa
Thanks
Leave a Reply