
Hello to all, welcome on therichpost.com. In this post, I will tell you, Angular 9 chart js working example and code.
Here is the complete working code and please implement carefully:
1. Here are the basics commands, you need to use into your terminal or command prompt to install Angular 9 fresh set up:
$ npm install -g @angular/cli //Setup Angular9 atmosphere

$ ng new angular9chartjs //Install New Angular App

/**You need to update your Nodejs also for this verison**/

$ cd angular9chartjs //Go inside the Angular 9 Project
2. After Install Angular 9 fresh setup and go inside the Angular 9 setup, run below command into your terminal to install chartjs module:
npm install --save chart.js
3. After all above setup, here is code, you need to add into your app.component.ts file:
import { Component, OnInit } from '@angular/core';
import * as Chart from 'chart.js';
@Component({
selector: 'app-chartjs',
templateUrl: './chartjs.component.html',
styleUrls: ['./chartjs.component.css']
})
export class AppComponent implements OnInit {
canvas: any;
ctx: any;
constructor() { }
ngOnInit(): void {
this.canvas = document.getElementById('myChart');
this.ctx = this.canvas.getContext('2d');
let myChart = new Chart(this.ctx, {
type: 'bar',
data: {
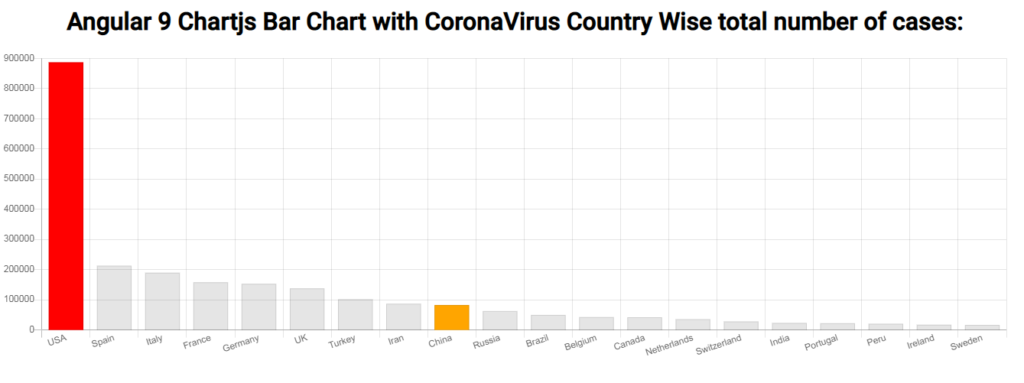
labels: ["USA", "Spain", "Italy", "France", "Germany", "UK", "Turkey", "Iran", "China", "Russia", "Brazil", "Belgium", "Canada", "Netherlands", "Switzerland", "India", "Portugal", "Peru", "Ireland", "Sweden"],
datasets: [{
label: 'Total cases.',
data: [886789, 213024, 189973, 158183, 153129, 138078, 101790, 87026, 82804, 62773, 50036, 42797, 42110, 35729, 28496, 23502, 22353, 20914, 17607, 16755],
backgroundColor: ["red", , , , , , , , "orange"],
borderWidth: 1
}]
},
options: {
legend: {
display: false
},
responsive: false,
display:true
}
});
}
}
4. Now, add below code into your app.component.html file:
<canvas id="myChart" width="1320" height="400"></canvas>
if you have any kind of query then please do comment below.
Jassa
Thank you
Leave a Reply