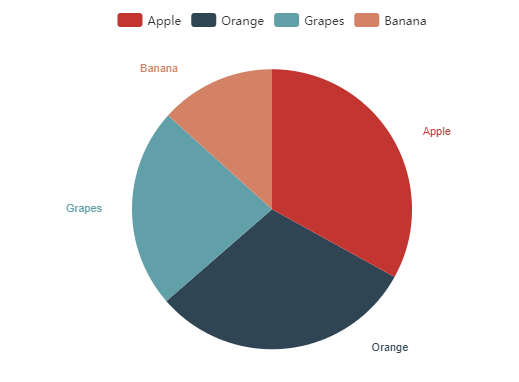
Hello to all, welcome to therichpost.com. I will tell you, Laravel – Pie Chart with Dynamic Data Working Example.
In this post, I am going to show dynamic data in PieChart from echarts. I have used Echarts library in it.
In this post, I will show laravel controller data to laravel blade template file with the help of laravel web routes.
Here is the working code, you need to follow:
1. Very first, you need to add below code into laravel blade template file piechart.blade.php:
I have used laravel controller data in json format:
<!DOCTYPE html>
<html>
<head>
<meta charset='utf-8' />
<script src="https://ajax.googleapis.com/ajax/libs/jquery/3.3.1/jquery.min.js"></script>
<script src="https://cdnjs.cloudflare.com/ajax/libs/echarts/4.1.0/echarts.min.js"></script>
<script>
$(function(){

  'use strict'

  /**************** PIE CHART ************/
  var pieData = [{
    name: 'Fruits',
    type: 'pie',
    radius: '80%',
    center: ['50%', '57.5%'],
    data: <?php echo json_encode($Data); ?>,
    label: {
      normal: {
        fontFamily: 'Roboto, sans-serif',
        fontSize: 11
      }
    },
    labelLine: {
      normal: {
        show: false
      }
    },
    markLine: {
      lineStyle: {
        normal: {
          width: 1
        }
      }
    }
  }];

  var pieOption = {
    tooltip: {
      trigger: 'item',
      formatter: '{a} <br/>{b}: {c} ({d}%)',
      textStyle: {
        fontSize: 11,
        fontFamily: 'Roboto, sans-serif'
      }
    },
    legend: {},
    series: pieData
  };

  var pie = document.getElementById('chartPie');
  var pieChart = echarts.init(pie);
  pieChart.setOption(pieOption);
   /** making all charts responsive when resize **/
});

</script>
</head>
<body>

  <div id="chartPie" style="height: 350px;"></div>

</body>
</html>
2. Second, here is the code, you need to add below code into laravel controller file HomeController.php:
I have made custom array data for pie chart and send this data to pie chart view:
public function Piechart()
    {
      $Data = array
                  (
                    "0" => array
                                    (
                                      "value" => 335,
                                      "name" => "Apple",
                                    ),
                    "1" => array
                                    (
                                      "value" => 310,
                                      "name" => "Orange",
                                    )
                                    ,
                    "2" => array
                                    (
                                      "value" => 234,
                                      "name" => "Grapes",
                                    )
                                    ,
                    "3" => array
                                    (
                                      "value" => 135,
                                      "name" => "Banana",
                                    )
                  );
        return view('piechart',['Data' => $Data]);
    }
3. Finally here is the code for route and you to add routes.web.php file:
Here I defined view and controller:
Route::get("/piechart", "HomeController@Piechart");
4. In the end, run php artisan serve command into you terminal and run you laravel application.
This is it, if you have any query related to this post, then do comment below or ask question.
Thank you,
Devil
TheRichPost

Leave a Reply
You must be logged in to post a comment.