
Hello friends, welcome back to my blog. Today this blog post will tell you, Angular 17 Free Admin Dashboard Template 3.
Angular 17 came and Bootstrap 5 also. If you are new then you must check below two links:
Friends now I proceed onwards and here is the working code snippet and please use carefully this to avoid the mistakes:
1. Firstly friends we need fresh angular 17 setup and for this we need to run below commands but if you already have angular 17 setup then you can avoid below commands. Secondly we should also have latest node version installed on our system:
npm install -g @angular/cli

ng new angularadmin //Create new Angular Project

cd angularadmin // Go inside the Angular Project Folder
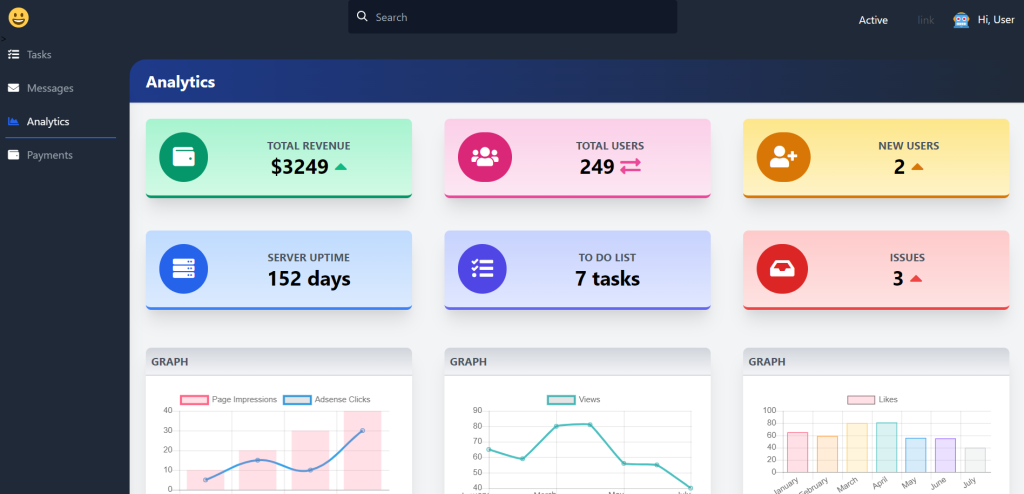
2. Now friends we just need to add below code into angularadmin/src/app/app.component.html file to get final out on the web browser:
<!--Nav-->
<nav class="bg-gray-800 pt-2 md:pt-1 pb-1 px-1 mt-0 h-auto fixed w-full z-20 top-0">
<div class="flex flex-wrap items-center">
<div class="flex flex-shrink md:w-1/3 justify-center md:justify-start text-white">
<a href="#">
<span class="text-xl pl-2"><i class="em em-grinning"></i></span>
</a>
</div>
<div class="flex flex-1 md:w-1/3 justify-center md:justify-start text-white px-2">
<span class="relative w-full">
<input type="search" placeholder="Search" class="w-full bg-gray-900 text-white transition border border-transparent focus:outline-none focus:border-gray-400 rounded py-3 px-2 pl-10 appearance-none leading-normal">
<div class="absolute search-icon" style="top: 1rem; left: .8rem;">
<svg class="fill-current pointer-events-none text-white w-4 h-4" xmlns="http://www.w3.org/2000/svg" viewBox="0 0 20 20">
<path d="M12.9 14.32a8 8 0 1 1 1.41-1.41l5.35 5.33-1.42 1.42-5.33-5.34zM8 14A6 6 0 1 0 8 2a6 6 0 0 0 0 12z"></path>
</svg>
</div>
</span>
</div>
<div class="flex w-full pt-2 content-center justify-between md:w-1/3 md:justify-end">
<ul class="list-reset flex justify-between flex-1 md:flex-none items-center">
<li class="flex-1 md:flex-none md:mr-3">
<a class="inline-block py-2 px-4 text-white no-underline" href="#">Active</a>
</li>
<li class="flex-1 md:flex-none md:mr-3">
<a class="inline-block text-gray-600 no-underline hover:text-gray-200 hover:text-underline py-2 px-4" href="#">link</a>
</li>
<li class="flex-1 md:flex-none md:mr-3">
<div class="relative inline-block">
<button onclick="toggleDD('myDropdown')" class="drop-button text-white focus:outline-none"> <span class="pr-2"><i class="em em-robot_face"></i></span> Hi, User </button>
</div>
</li>
</ul>
</div>
</div>
</nav>
<div class="flex flex-col md:flex-row">
<div class="bg-gray-800 shadow-xl h-16 fixed bottom-0 mt-12 md:relative md:h-screen z-10 w-full md:w-48">
<div class="md:mt-12 md:w-48 md:fixed md:left-0 md:top-0 content-center md:content-start text-left justify-between">
<ul class="list-reset flex flex-row md:flex-col py-0 md:py-3 px-1 md:px-2 text-center md:text-left">
<li class="mr-3 flex-1">
<a href="#" class="block py-1 md:py-3 pl-1 align-middle text-white no-underline hover:text-white border-b-2 border-gray-800 hover:border-pink-500">
<i class="fas fa-tasks pr-0 md:pr-3"></i><span class="pb-1 md:pb-0 text-xs md:text-base text-gray-600 md:text-gray-400 block md:inline-block">Tasks</span>
</a>
</li>
<li class="mr-3 flex-1">
<a href="#" class="block py-1 md:py-3 pl-1 align-middle text-white no-underline hover:text-white border-b-2 border-gray-800 hover:border-purple-500">
<i class="fa fa-envelope pr-0 md:pr-3"></i><span class="pb-1 md:pb-0 text-xs md:text-base text-gray-600 md:text-gray-400 block md:inline-block">Messages</span>
</a>
</li>
<li class="mr-3 flex-1">
<a href="#" class="block py-1 md:py-3 pl-1 align-middle text-white no-underline hover:text-white border-b-2 border-blue-600">
<i class="fas fa-chart-area pr-0 md:pr-3 text-blue-600"></i><span class="pb-1 md:pb-0 text-xs md:text-base text-white md:text-white block md:inline-block">Analytics</span>
</a>
</li>
<li class="mr-3 flex-1">
<a href="#" class="block py-1 md:py-3 pl-0 md:pl-1 align-middle text-white no-underline hover:text-white border-b-2 border-gray-800 hover:border-red-500">
<i class="fa fa-wallet pr-0 md:pr-3"></i><span class="pb-1 md:pb-0 text-xs md:text-base text-gray-600 md:text-gray-400 block md:inline-block">Payments</span>
</a>
</li>
</ul>
</div>
</div>
<div class="main-content flex-1 bg-gray-100 mt-12 md:mt-2 pb-24 md:pb-5">
<div class="bg-gray-800 pt-3">
<div class="rounded-tl-3xl bg-gradient-to-r from-blue-900 to-gray-800 p-4 shadow text-2xl text-white">
<h3 class="font-bold pl-2">Analytics</h3>
</div>
</div>
<div class="flex flex-wrap">
<div class="w-full md:w-1/2 xl:w-1/3 p-6">
<!--Metric Card-->
<div class="bg-gradient-to-b from-green-200 to-green-100 border-b-4 border-green-600 rounded-lg shadow-xl p-5">
<div class="flex flex-row items-center">
<div class="flex-shrink pr-4">
<div class="rounded-full p-5 bg-green-600"><i class="fa fa-wallet fa-2x fa-inverse"></i></div>
</div>
<div class="flex-1 text-right md:text-center">
<h5 class="font-bold uppercase text-gray-600">Total Revenue</h5>
<h3 class="font-bold text-3xl">$3249 <span class="text-green-500"><i class="fas fa-caret-up"></i></span></h3>
</div>
</div>
</div>
<!--/Metric Card-->
</div>
<div class="w-full md:w-1/2 xl:w-1/3 p-6">
<!--Metric Card-->
<div class="bg-gradient-to-b from-pink-200 to-pink-100 border-b-4 border-pink-500 rounded-lg shadow-xl p-5">
<div class="flex flex-row items-center">
<div class="flex-shrink pr-4">
<div class="rounded-full p-5 bg-pink-600"><i class="fas fa-users fa-2x fa-inverse"></i></div>
</div>
<div class="flex-1 text-right md:text-center">
<h5 class="font-bold uppercase text-gray-600">Total Users</h5>
<h3 class="font-bold text-3xl">249 <span class="text-pink-500"><i class="fas fa-exchange-alt"></i></span></h3>
</div>
</div>
</div>
<!--/Metric Card-->
</div>
<div class="w-full md:w-1/2 xl:w-1/3 p-6">
<!--Metric Card-->
<div class="bg-gradient-to-b from-yellow-200 to-yellow-100 border-b-4 border-yellow-600 rounded-lg shadow-xl p-5">
<div class="flex flex-row items-center">
<div class="flex-shrink pr-4">
<div class="rounded-full p-5 bg-yellow-600"><i class="fas fa-user-plus fa-2x fa-inverse"></i></div>
</div>
<div class="flex-1 text-right md:text-center">
<h5 class="font-bold uppercase text-gray-600">New Users</h5>
<h3 class="font-bold text-3xl">2 <span class="text-yellow-600"><i class="fas fa-caret-up"></i></span></h3>
</div>
</div>
</div>
<!--/Metric Card-->
</div>
<div class="w-full md:w-1/2 xl:w-1/3 p-6">
<!--Metric Card-->
<div class="bg-gradient-to-b from-blue-200 to-blue-100 border-b-4 border-blue-500 rounded-lg shadow-xl p-5">
<div class="flex flex-row items-center">
<div class="flex-shrink pr-4">
<div class="rounded-full p-5 bg-blue-600"><i class="fas fa-server fa-2x fa-inverse"></i></div>
</div>
<div class="flex-1 text-right md:text-center">
<h5 class="font-bold uppercase text-gray-600">Server Uptime</h5>
<h3 class="font-bold text-3xl">152 days</h3>
</div>
</div>
</div>
<!--/Metric Card-->
</div>
<div class="w-full md:w-1/2 xl:w-1/3 p-6">
<!--Metric Card-->
<div class="bg-gradient-to-b from-indigo-200 to-indigo-100 border-b-4 border-indigo-500 rounded-lg shadow-xl p-5">
<div class="flex flex-row items-center">
<div class="flex-shrink pr-4">
<div class="rounded-full p-5 bg-indigo-600"><i class="fas fa-tasks fa-2x fa-inverse"></i></div>
</div>
<div class="flex-1 text-right md:text-center">
<h5 class="font-bold uppercase text-gray-600">To Do List</h5>
<h3 class="font-bold text-3xl">7 tasks</h3>
</div>
</div>
</div>
<!--/Metric Card-->
</div>
<div class="w-full md:w-1/2 xl:w-1/3 p-6">
<!--Metric Card-->
<div class="bg-gradient-to-b from-red-200 to-red-100 border-b-4 border-red-500 rounded-lg shadow-xl p-5">
<div class="flex flex-row items-center">
<div class="flex-shrink pr-4">
<div class="rounded-full p-5 bg-red-600"><i class="fas fa-inbox fa-2x fa-inverse"></i></div>
</div>
<div class="flex-1 text-right md:text-center">
<h5 class="font-bold uppercase text-gray-600">Issues</h5>
<h3 class="font-bold text-3xl">3 <span class="text-red-500"><i class="fas fa-caret-up"></i></span></h3>
</div>
</div>
</div>
<!--/Metric Card-->
</div>
</div>
<div class="flex flex-row flex-wrap flex-grow mt-2">
<div class="w-full md:w-1/2 xl:w-1/3 p-6">
<!--Graph Card-->
<div class="bg-white border-transparent rounded-lg shadow-xl">
<div class="bg-gradient-to-b from-gray-300 to-gray-100 uppercase text-gray-800 border-b-2 border-gray-300 rounded-tl-lg rounded-tr-lg p-2">
<h5 class="font-bold uppercase text-gray-600">Graph</h5>
</div>
<div class="p-5">
<canvas id="chartjs-7" class="chartjs" width="undefined" height="undefined"></canvas>
<script>
new Chart(document.getElementById("chartjs-7"), {
"type": "bar",
"data": {
"labels": ["January", "February", "March", "April"],
"datasets": [{
"label": "Page Impressions",
"data": [10, 20, 30, 40],
"borderColor": "rgb(255, 99, 132)",
"backgroundColor": "rgba(255, 99, 132, 0.2)"
}, {
"label": "Adsense Clicks",
"data": [5, 15, 10, 30],
"type": "line",
"fill": false,
"borderColor": "rgb(54, 162, 235)"
}]
},
"options": {
"scales": {
"yAxes": [{
"ticks": {
"beginAtZero": true
}
}]
}
}
});
</script>
</div>
</div>
<!--/Graph Card-->
</div>
<div class="w-full md:w-1/2 xl:w-1/3 p-6">
<!--Graph Card-->
<div class="bg-white border-transparent rounded-lg shadow-xl">
<div class="bg-gradient-to-b from-gray-300 to-gray-100 uppercase text-gray-800 border-b-2 border-gray-300 rounded-tl-lg rounded-tr-lg p-2">
<h5 class="font-bold uppercase text-gray-600">Graph</h5>
</div>
<div class="p-5">
<canvas id="chartjs-0" class="chartjs" width="undefined" height="undefined"></canvas>
<script>
new Chart(document.getElementById("chartjs-0"), {
"type": "line",
"data": {
"labels": ["January", "February", "March", "April", "May", "June", "July"],
"datasets": [{
"label": "Views",
"data": [65, 59, 80, 81, 56, 55, 40],
"fill": false,
"borderColor": "rgb(75, 192, 192)",
"lineTension": 0.1
}]
},
"options": {}
});
</script>
</div>
</div>
<!--/Graph Card-->
</div>
<div class="w-full md:w-1/2 xl:w-1/3 p-6">
<!--Graph Card-->
<div class="bg-white border-transparent rounded-lg shadow-xl">
<div class="bg-gradient-to-b from-gray-300 to-gray-100 uppercase text-gray-800 border-b-2 border-gray-300 rounded-tl-lg rounded-tr-lg p-2">
<h5 class="font-bold uppercase text-gray-600">Graph</h5>
</div>
<div class="p-5">
<canvas id="chartjs-1" class="chartjs" width="undefined" height="undefined"></canvas>
<script>
new Chart(document.getElementById("chartjs-1"), {
"type": "bar",
"data": {
"labels": ["January", "February", "March", "April", "May", "June", "July"],
"datasets": [{
"label": "Likes",
"data": [65, 59, 80, 81, 56, 55, 40],
"fill": false,
"backgroundColor": ["rgba(255, 99, 132, 0.2)", "rgba(255, 159, 64, 0.2)", "rgba(255, 205, 86, 0.2)", "rgba(75, 192, 192, 0.2)", "rgba(54, 162, 235, 0.2)", "rgba(153, 102, 255, 0.2)", "rgba(201, 203, 207, 0.2)"],
"borderColor": ["rgb(255, 99, 132)", "rgb(255, 159, 64)", "rgb(255, 205, 86)", "rgb(75, 192, 192)", "rgb(54, 162, 235)", "rgb(153, 102, 255)", "rgb(201, 203, 207)"],
"borderWidth": 1
}]
},
"options": {
"scales": {
"yAxes": [{
"ticks": {
"beginAtZero": true
}
}]
}
}
});
</script>
</div>
</div>
<!--/Graph Card-->
</div>
<div class="w-full md:w-1/2 xl:w-1/3 p-6">
<!--Graph Card-->
<div class="bg-white border-transparent rounded-lg shadow-xl">
<div class="bg-gradient-to-b from-gray-300 to-gray-100 uppercase text-gray-800 border-b-2 border-gray-300 rounded-tl-lg rounded-tr-lg p-2">
<h5 class="font-bold uppercase text-gray-600">Graph</h5>
</div>
<div class="p-5"><canvas id="chartjs-4" class="chartjs" width="undefined" height="undefined"></canvas>
<script>
new Chart(document.getElementById("chartjs-4"), {
"type": "doughnut",
"data": {
"labels": ["P1", "P2", "P3"],
"datasets": [{
"label": "Issues",
"data": [300, 50, 100],
"backgroundColor": ["rgb(255, 99, 132)", "rgb(54, 162, 235)", "rgb(255, 205, 86)"]
}]
}
});
</script>
</div>
</div>
<!--/Graph Card-->
</div>
<div class="w-full md:w-1/2 xl:w-1/3 p-6">
<!--Table Card-->
<div class="bg-white border-transparent rounded-lg shadow-xl">
<div class="bg-gradient-to-b from-gray-300 to-gray-100 uppercase text-gray-800 border-b-2 border-gray-300 rounded-tl-lg rounded-tr-lg p-2">
<h5 class="font-bold uppercase text-gray-600">Graph</h5>
</div>
<div class="p-5">
<table class="w-full p-5 text-gray-700">
<thead>
<tr>
<th class="text-left text-blue-900">Name</th>
<th class="text-left text-blue-900">Side</th>
<th class="text-left text-blue-900">Role</th>
</tr>
</thead>
<tbody>
<tr>
<td>Obi Wan Kenobi</td>
<td>Light</td>
<td>Jedi</td>
</tr>
<tr>
<td>Greedo</td>
<td>South</td>
<td>Scumbag</td>
</tr>
<tr>
<td>Darth Vader</td>
<td>Dark</td>
<td>Sith</td>
</tr>
</tbody>
</table>
<p class="py-2"><a href="#">See More issues...</a></p>
</div>
</div>
<!--/table Card-->
</div>
<div class="w-full md:w-1/2 xl:w-1/3 p-6">
<!--Advert Card-->
<div class="bg-white border-transparent rounded-lg shadow-xl">
<div class="bg-gradient-to-b from-gray-300 to-gray-100 uppercase text-gray-800 border-b-2 border-gray-300 rounded-tl-lg rounded-tr-lg p-2">
<h5 class="font-bold uppercase text-gray-600">Advert</h5>
</div>
<div class="p-5 text-center">
Code like always, build like never before. See for yourself. ads via Carbon
</div>
</div>
<!--/Advert Card-->
</div>
</div>
</div>
</div>
3. Now friends we just need to add below stylesheet url code into angularadmin/src/index.html file for font awesome icons, css and js:
<!doctype html>
<html lang="en">
<head>
  <meta charset="utf-8">
  <title>Angular17</title>
  <base href="/">
  <meta name="viewport" content="width=device-width, initial-scale=1">
  <link rel="icon" type="image/x-icon" href="favicon.ico">


  <link href="https://fonts.googleapis.com/css?family=Nunito:400,700,800" rel="stylesheet">
  <link rel="stylesheet" href="https://use.fontawesome.com/releases/v5.3.1/css/all.css" integrity="sha384-mzrmE5qonljUremFsqc01SB46JvROS7bZs3IO2EmfFsd15uHvIt+Y8vEf7N7fWAU" crossorigin="anonymous">
  <link href="https://unpkg.com/tailwindcss@2.2.19/dist/tailwind.min.css" rel=" stylesheet">
  <!--Replace with your tailwind.css once created-->
  <link href="https://afeld.github.io/emoji-css/emoji.css" rel="stylesheet">

</head>
<body class="bg-gray-800 font-sans leading-normal tracking-normal mt-12">>
  <app-root></app-root>
  <!--Totally optional :) -->
  <script src="https://cdnjs.cloudflare.com/ajax/libs/Chart.js/2.7.2/Chart.bundle.min.js" integrity="sha256-XF29CBwU1MWLaGEnsELogU6Y6rcc5nCkhhx89nFMIDQ=" crossorigin="anonymous"></script>
</body>
</html>
4. Now friends we just need to add below code into angularadmin/angular.json file to custom.js file working code:
...

            ],
            "scripts": [
           "src/assets/custom.js",

            ],
...
5. Guys now we need to create custom.js file inside angularadin/src/assets folder and add below code inside it:
setTimeout(function(){
   new Chart(document.getElementById("chartjs-7"), {
       "type": "bar",
       "data": {
           "labels": ["January", "February", "March", "April"],
           "datasets": [{
               "label": "Page Impressions",
               "data": [10, 20, 30, 40],
               "borderColor": "rgb(255, 99, 132)",
               "backgroundColor": "rgba(255, 99, 132, 0.2)"
           }, {
               "label": "Adsense Clicks",
               "data": [5, 15, 10, 30],
               "type": "line",
               "fill": false,
               "borderColor": "rgb(54, 162, 235)"
           }]
       },
       "options": {
           "scales": {
               "yAxes": [{
                   "ticks": {
                       "beginAtZero": true
                   }
               }]
           }
       }
   });
   new Chart(document.getElementById("chartjs-0"), {
                                   "type": "line",
                                   "data": {
                                       "labels": ["January", "February", "March", "April", "May", "June", "July"],
                                       "datasets": [{
                                           "label": "Views",
                                           "data": [65, 59, 80, 81, 56, 55, 40],
                                           "fill": false,
                                           "borderColor": "rgb(75, 192, 192)",
                                           "lineTension": 0.1
                                       }]
                                   },
                                   "options": {}
                               });
                               new Chart(document.getElementById("chartjs-1"), {
                                   "type": "bar",
                                   "data": {
                                       "labels": ["January", "February", "March", "April", "May", "June", "July"],
                                       "datasets": [{
                                           "label": "Likes",
                                           "data": [65, 59, 80, 81, 56, 55, 40],
                                           "fill": false,
                                           "backgroundColor": ["rgba(255, 99, 132, 0.2)", "rgba(255, 159, 64, 0.2)", "rgba(255, 205, 86, 0.2)", "rgba(75, 192, 192, 0.2)", "rgba(54, 162, 235, 0.2)", "rgba(153, 102, 255, 0.2)", "rgba(201, 203, 207, 0.2)"],
                                           "borderColor": ["rgb(255, 99, 132)", "rgb(255, 159, 64)", "rgb(255, 205, 86)", "rgb(75, 192, 192)", "rgb(54, 162, 235)", "rgb(153, 102, 255)", "rgb(201, 203, 207)"],
                                           "borderWidth": 1
                                       }]
                                   },
                                   "options": {
                                       "scales": {
                                           "yAxes": [{
                                               "ticks": {
                                                   "beginAtZero": true
                                               }
                                           }]
                                       }
                                   }
                               });
                               new Chart(document.getElementById("chartjs-4"), {
                                   "type": "doughnut",
                                   "data": {
                                       "labels": ["P1", "P2", "P3"],
                                       "datasets": [{
                                           "label": "Issues",
                                           "data": [300, 50, 100],
                                           "backgroundColor": ["rgb(255, 99, 132)", "rgb(54, 162, 235)", "rgb(255, 205, 86)"]
                                       }]
                                   }
                               });

 }, 1000);
Friends in the end must run ng serve command into your terminal to run the angular 17 project(localhost:4200).
Now we are done friends. If you have any kind of query, suggestion and new requirement then feel free to comment below.
Note: Friends, In this post, I just tell the basic setup and things, you can change the code according to your requirements.
I will appreciate that if you will tell your views for this post. Nothing matters if your views will be good or bad because with your views, I will make my next posts more good and helpful.
Jassa
Thanks
Leave a Reply