Hello to all, welcome to therichpost.com. In this post, I will tell you, Angular 13 Chartjs Working Demo with Dynamic Data.

Angular13 came and if you are new then you must check below link:
Here is the code snippet and please use carefully:
1. Very first guys, here are common basics steps to add angular 13 application on your machine and also we must have latest nodejs version(14.17.0) installed for angular 13:
$ npm install -g @angular/cli

$ ng new angularcharts // Set Angular 13 Application on your pc

cd angularcharts // Go inside project folder
2. Now run below commands to set chartjs modules into our angular 13 application:
npm install angular2-chartjs
3. Now we will add below code into our angularcharts/src/app/app.module.ts file:
...
import { ChartModule } from 'angular2-chartjs';
import { HttpClientModule } from '@angular/common/http';
@NgModule({
  ..
  imports: [
   ...
    ChartModule,
    HttpClientModule
  ],
4. Now we will add below code into our angularcharts/src/app/app.component.ts file:
...
import { HttpClient } from '@angular/common/http';
export class AppComponent {
...
constructor(private http:HttpClient) {}

//Bar Chart

type = 'bar';
         options = {
            responsive: true,
            maintainAspectRatio: true,
            scales: {
                yAxes : [{
                    ticks : {
                        max : 100,
                        min : 0
                    }
                }]
            }
        };
        data:any;
        barchart:any;
        ngOnInit(){
            //web api call
            this.http.get('http://localhost/chartjs.php').subscribe(data => {
                this.barchart = data;


                this.data = {
                    labels: this.barchart[0], //months
                    datasets: [{
                    label: "Angular 12",
                    data: this.barchart[1][0],
                    backgroundColor: "#f38b4a",
                    },{
                        label: "Angular 13",
                        data: this.barchart[1][1],
                        backgroundColor: "#6970d5",
                    }]
                };


        });
}

}
5. Finally we will add below code into our angularcharts/src/app/app.component.html file:
<chart [type]="type" [data]="data" [options]="options"></chart>
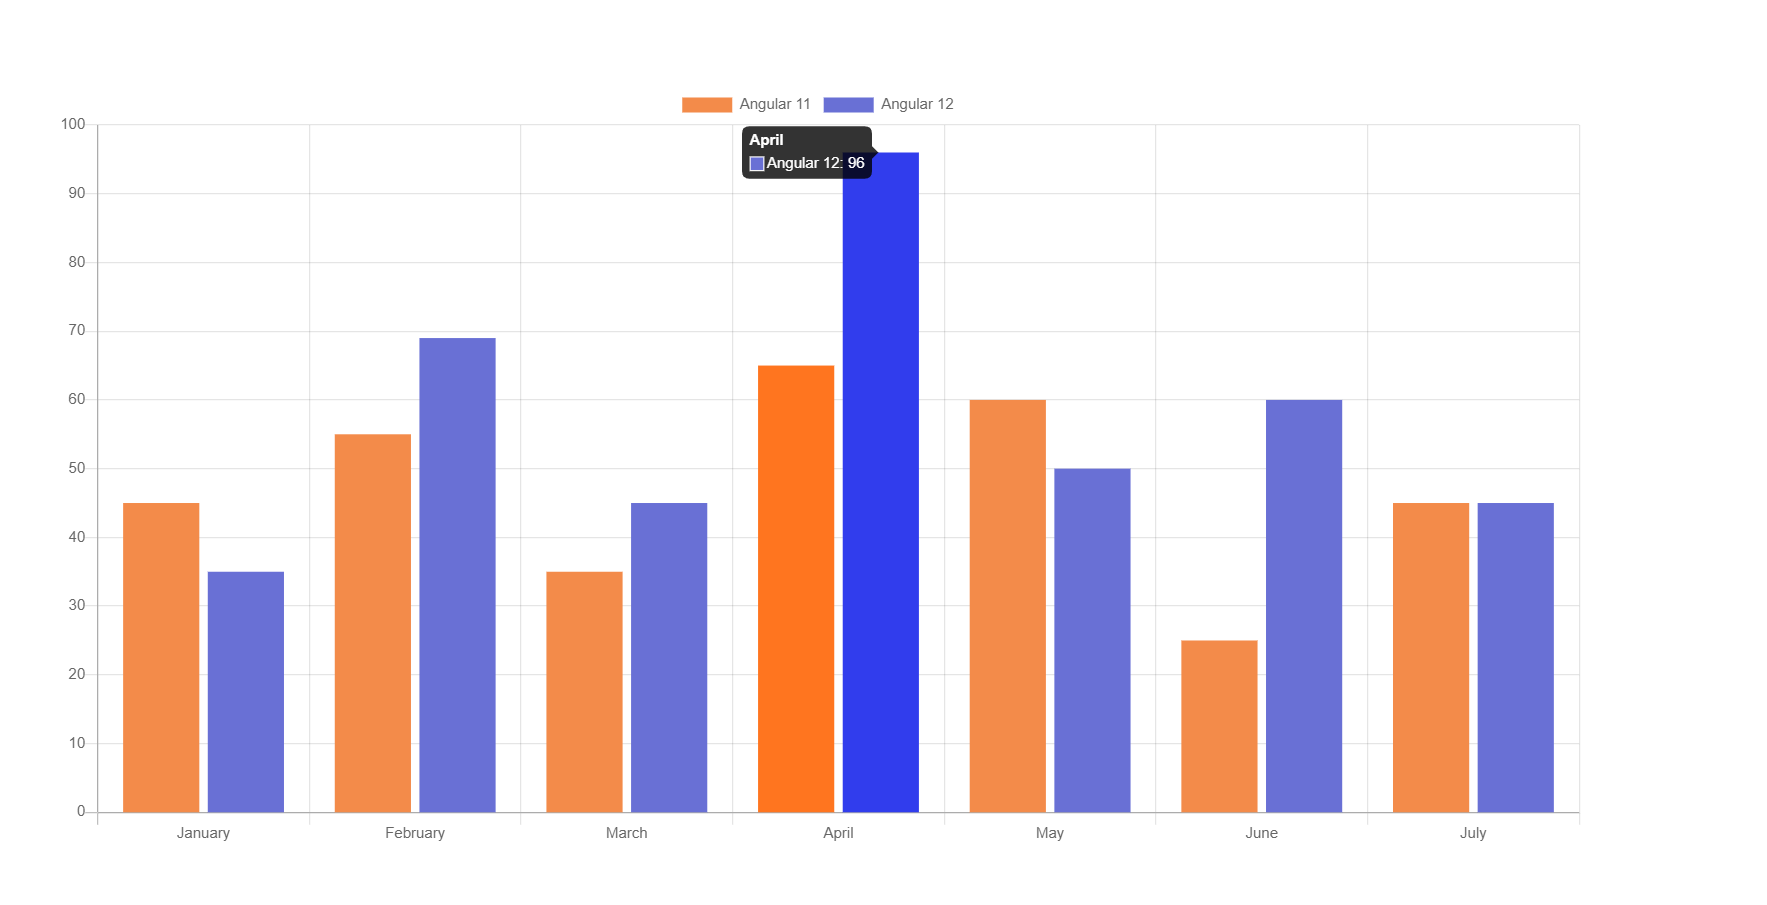
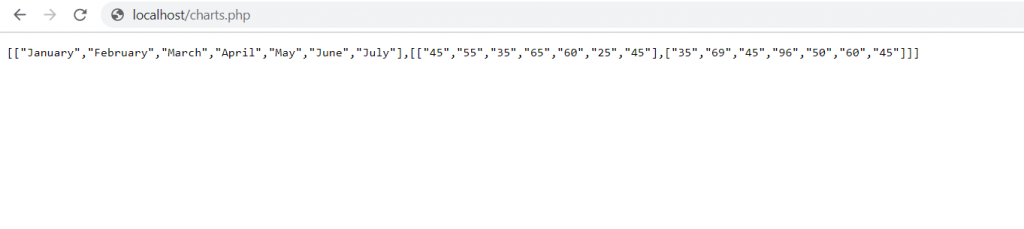
6. Guys here is my chartjs.php file data and this file is located inside xampp/htdocs folder:
<?php
header('Access-Control-Allow-Origin: *');
header('Content-Type: application/json');


  $months = array("January", "February", "March", "April", "May", "June", "July");
  $sales = array(array("45", "55", "35", "65", "60", "25", "45"), array("35", "69", "45", "96", "50", "60", "45"));
  echo json_encode(array($months,$sales));
  die();

?>
Now we are done friends and please run ng serve command to check the output in browser(locahost:4200) and if you have any kind of query then please do comment below.
Note: Friends, I just tell the basic setup and things, you can change the code according to your requirements. For better understanding must watch video above.
I will appreciate that if you will tell your views for this post. Nothing matters if your views will be good or bad.
Jassa
Thanks
Leave a Reply
You must be logged in to post a comment.