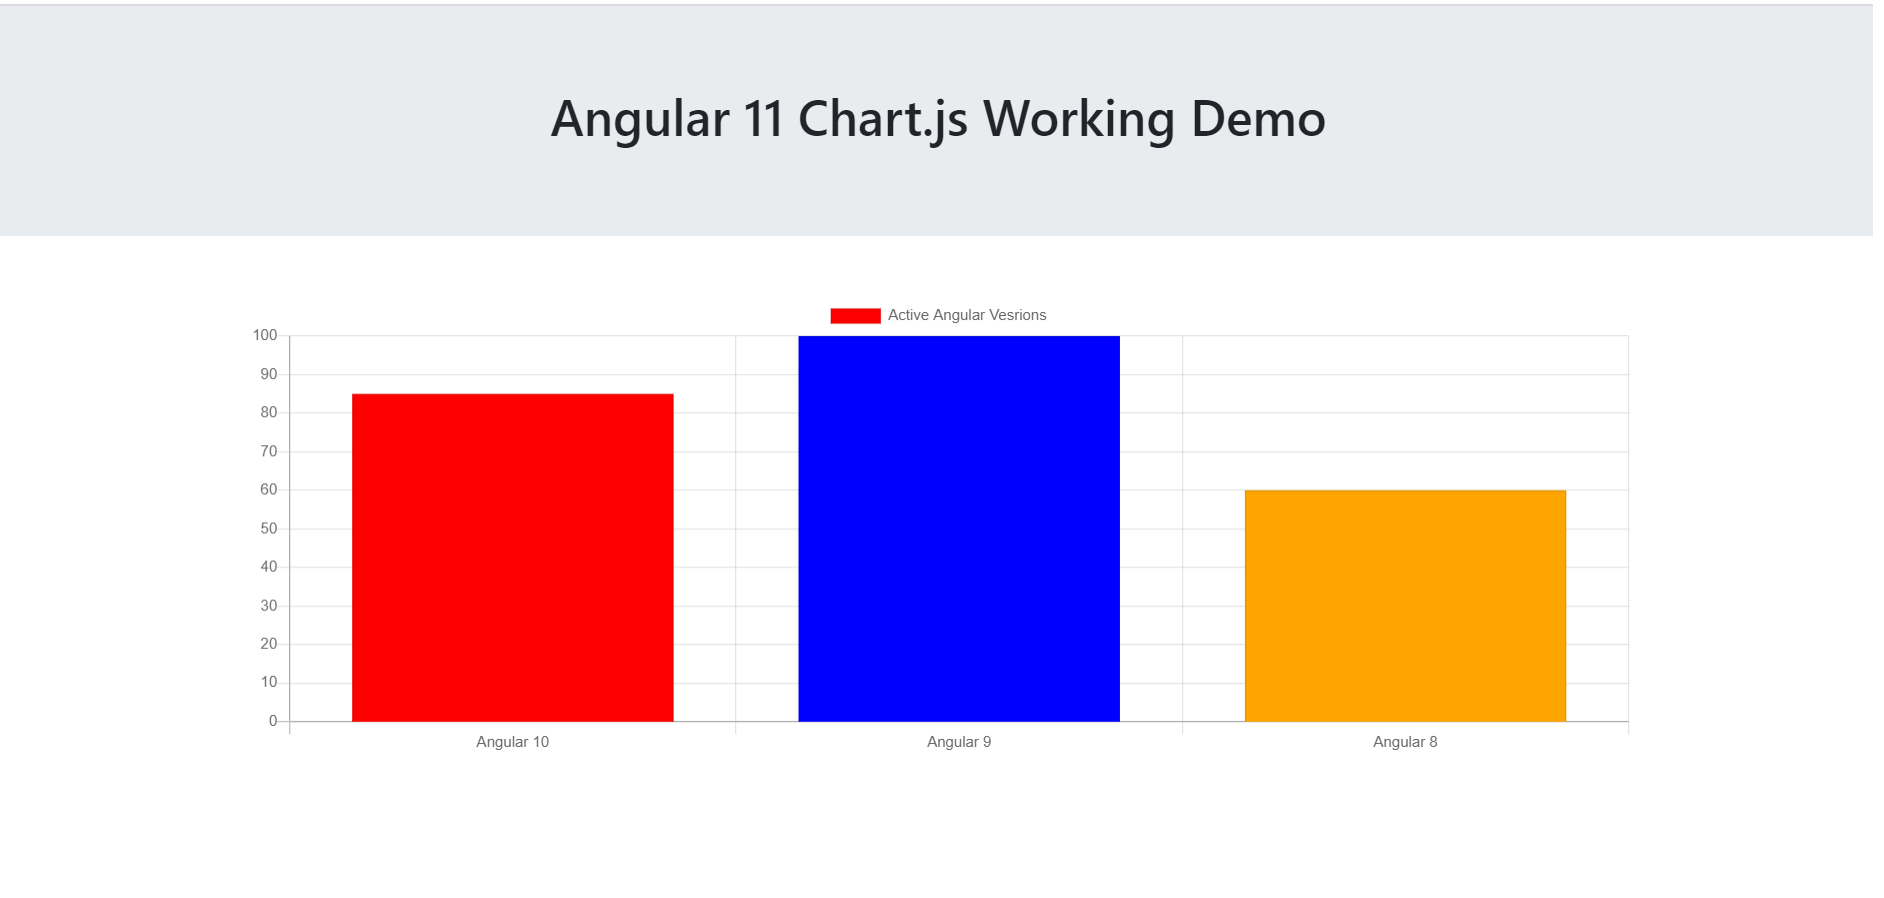
Hello to all, welcome back on my blog. Today in this blog post, I am going to tell you, Angular 11 Chartjs Working Demo.
Angular11 came and if you are new then you must check below two links:
Friends now I proceed onwards and here is the working code snippet for Angular 11 Chartjs Working Demo and use this carefully to avoid the mistakes:
1. Firstly friends we need fresh angular 11 setup and for this we need to run below commands but if you already have angular 11 setup then you can avoid below commands. Secondly we should also have latest node version installed on our system:
Guys you can skip this first step if you already have angular 11 fresh setup:
npm install -g @angular/cli

ng new angularcharts //Create new Angular Project

cd angularcharts  // Go inside the Angular Project Folder

ng serve --open // Run and Open the Angular Project

http://localhost:4200/ // Working Angular Project Url
2. Now friends, here we need to run below commands into our project terminal to install chartjs modules into our angular application:
npm install --save chart.js
ng serve
3. Now add below code into your src/app/app.component.ts file:
...
import * as Chart from 'chart.js';

export class AppComponent {
canvas:any; ctx:any; canvas2:any; ctx2:any; canvas3:any; ctx3:any;
...
ngOnInit(){
...
this.canvas = document.getElementById('myChart');
this.canvas2 = document.getElementById('myChart2');
this.canvas3 = document.getElementById('myChart3');
this.ctx = this.canvas.getContext('2d');
this.ctx2 = this.canvas2.getContext('2d');
  this.ctx3 = this.canvas3.getContext('2d');
    let myChart = new Chart(this.ctx, {
      type: 'bar',
      data: {
          labels: ["Angular 11", "Angular 10", "Angular 9"],
          datasets: [{
              label: 'Active Angular Vesrions',
              data: [85, 100, 60],
              backgroundColor: ["red","blue", "orange"],
              borderWidth: 1
          }]
      },
      options: {
    legend: {
        display: true
    },
        responsive: true,
        display:true,
    scales: {
        yAxes: [{
            ticks: {
                beginAtZero: true
            }
        }]
    }
      }
    });

  let myChart2 = new Chart(this.ctx2, {
      type: 'pie',
      data: {
          labels: ["Angular 11", "Angular 10", "Angular 9"],
          datasets: [{
              label: 'Active Angular Vesrions',
              data: [85, 100, 60],
              backgroundColor: ["red","blue", "orange"],
              borderWidth: 1
          }]
      },
      options: {
    legend: {
        display: true
    },
        responsive: true,
        display:true,
    scales: {
        yAxes: [{
            ticks: {
                beginAtZero: true
            }
        }]
    }
      }
    });

  let myChart3 = new Chart(this.ctx3, {
      type: 'line',
      data: {
          labels: ["Angular 11", "Angular 10", "Angular 9"],
          datasets: [{
              label: 'Active Angular Vesrions',
              data: [85, 100, 60],
              backgroundColor: ["red","blue", "orange"],
              borderWidth: 1
          }]
      },
      options: {
    legend: {
        display: true
    },
        responsive: true,
        display:true,
    scales: {
        yAxes: [{
            ticks: {
                beginAtZero: true
            }
        }]
    }
      }
    });
}
}
4. Finally add below code into your src/app/app.component.html file, which will show output on browser:
<canvas id="myChart" width="1200px" height="400"></canvas>

<canvas class="mt-5" id="myChart2" width="1200px" height="400"></canvas>

<canvas class="mt-5" id="myChart3" width="1200px" height="400"></canvas>
Now we are done friends and please run ng serve command and if you have any kind of query then please do comment below.
Note: Friends, I just tell the basic setup and things, you can change the code according to your requirements. For better understanding must watch video above.
I will appreciate that if you will tell your views for this post. Nothing matters if your views will be good or bad.
Jassa
Thanks

Leave a Reply
You must be logged in to post a comment.