Hello my friends, welcome back to my blog. Today in this blog post, I am going to show you, Vuejs Customize Pie charts Multiple Demos.
Vue 3 came and if you are new then you must check below link::
Vuejs
Friends now I proceed onwards and here is the working code snippet for Vuejs Customize Pie charts Multiple Demos and please use this carefully to avoid the mistakes:
1. Firstly friends we need fresh vuejs(Vue 3) setup and for that we need to run below commands into our terminal and also w should have latest node version installed on our system:
Guys you can skip this first step if you already have vuejs fresh setup:
npm install -g @vue/cli

vue create vuecharts

cd vuecharts

npm install bootstrap --save

npm install chart.js --save

npm i jquery --save

npm run serve //http://localhost:8080/
2. Now friends please create new file “App.css” inside src folder and add below code inside it:
body {
  background-color: #f6f9fb!important;
}

.text-small {
  font-size: 0.9rem;
}

.rounded {
  border-radius: 1rem;
}

.position-center {
  top: 50%;
  left: 50%;
  transform: translateX(-50%) translateY(-50%);
}

a {
  color: inherit;
  text-decoration: none;
}
3. Finally friends we need to add below code into our src/App.vue file to get final output on web browser:
<template>
<!-- FOR DEMO PURPOSE -->
<section class="pt-5">
<div class="container pt-5">
<div class="card border-0 rounded shadow-sm">
<div class="card-body p-5">
<div class="row">
<div class="col-lg-6">
<h1 class="fw-bold">Vuejs Vue 3 Pie charts examples - therichpost.com</h1>
</div>
</div>
</div>
</div>
</div>
</section>
<section class="py-5">
<div class="container py-5">
<div class="row">
<div class="col-lg-6 mb-4">
<div class="card border-0 shadow-sm rounded">
<div class="card-body p-4">
<div class="row align-items-center">
<div class="col-lg-6">
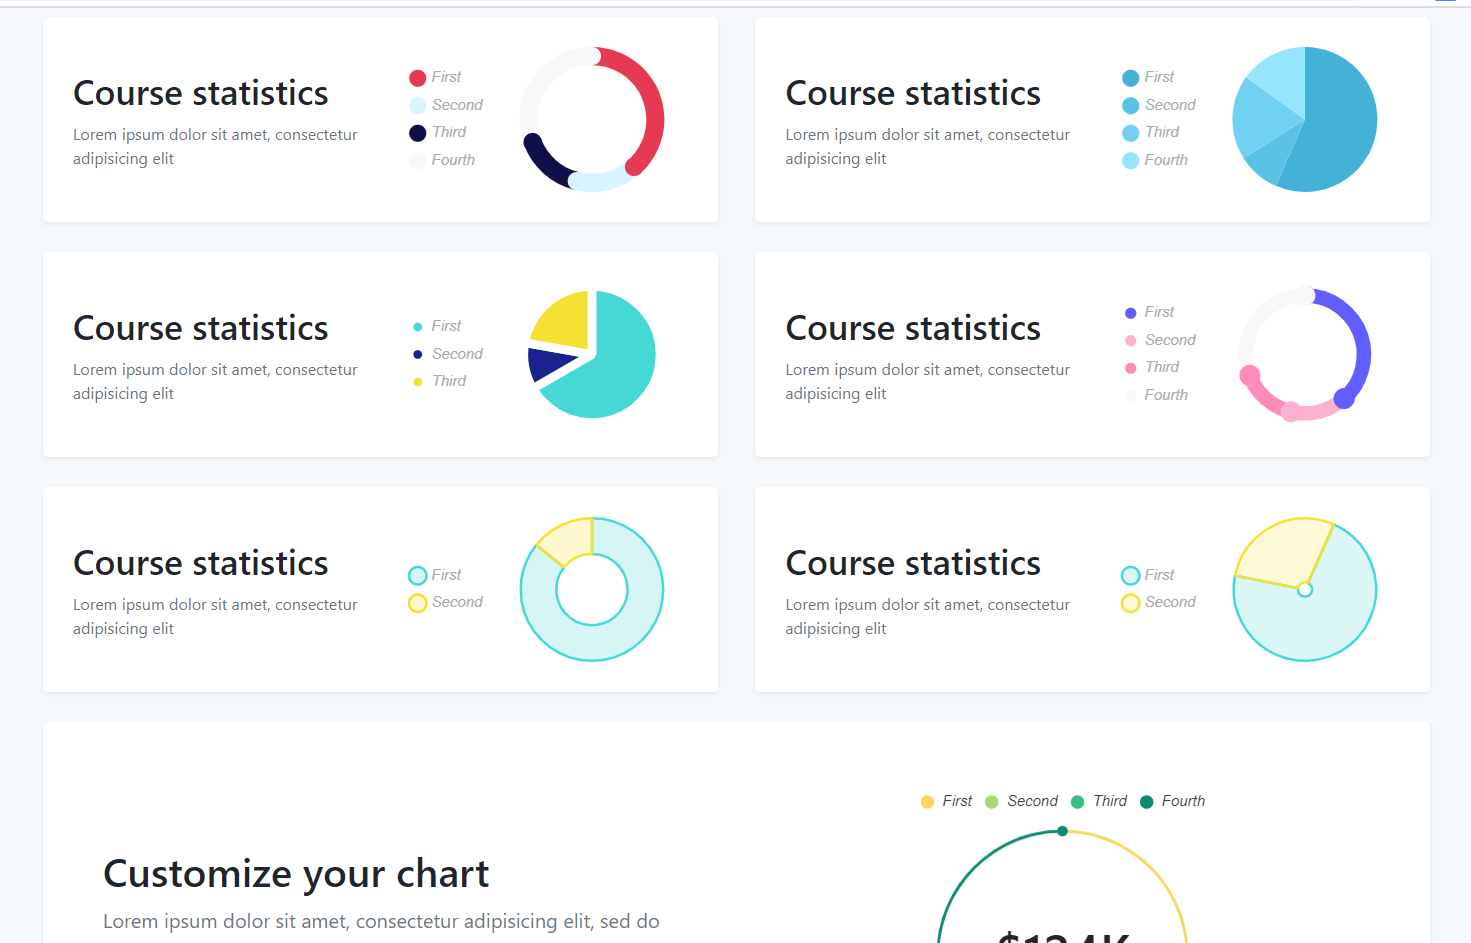
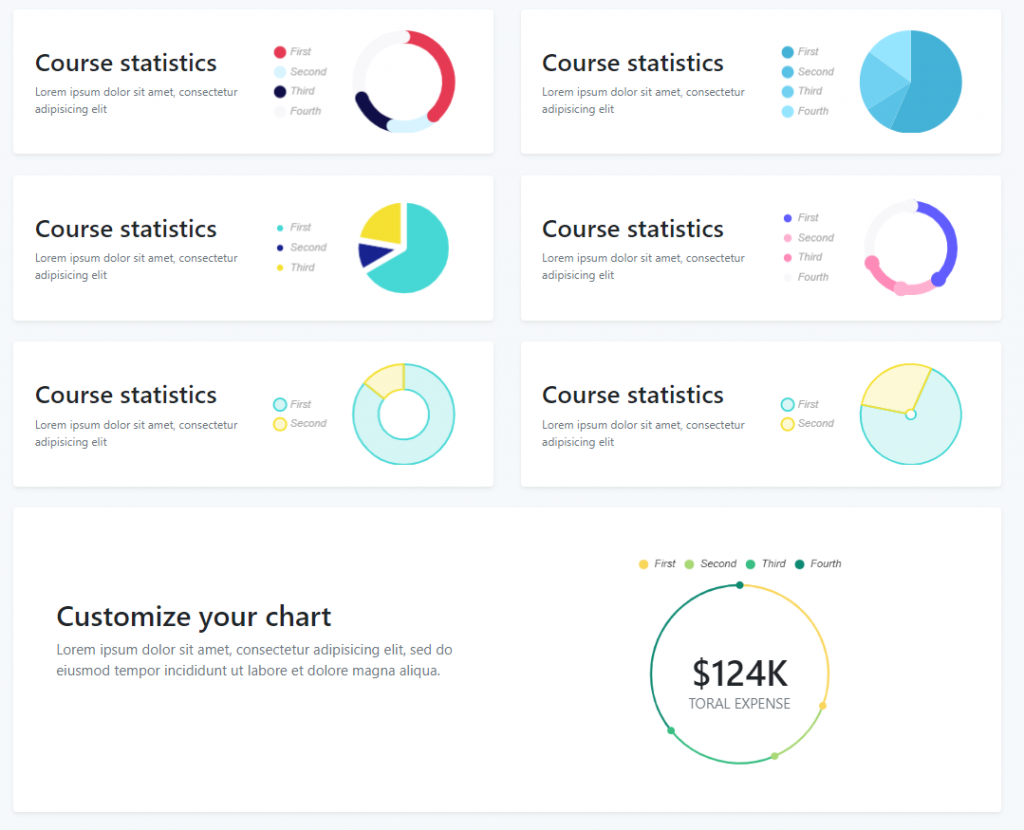
<h3 class="fw-bold">Course statistics</h3>
<p class="small text-muted mb-0">Lorem ipsum dolor sit amet, consectetur adipisicing elit</p>
</div>
<div class="col-lg-6">
<!-- Example 1 -->
<canvas id="pieChart1"></canvas>
</div>
</div>
</div>
</div>
</div>
<div class="col-lg-6 mb-4">
<div class="card border-0 shadow-sm rounded">
<div class="card-body p-4">
<div class="row align-items-center">
<div class="col-lg-6">
<h3 class="fw-bold">Course statistics</h3>
<p class="small text-muted mb-0">Lorem ipsum dolor sit amet, consectetur adipisicing elit</p>
</div>
<div class="col-lg-6">
<!-- Example 2 -->
<canvas id="pieChart2"></canvas>
</div>
</div>
</div>
</div>
</div>
<div class="col-lg-6 mb-4">
<div class="card border-0 shadow-sm rounded">
<div class="card-body p-4">
<div class="row align-items-center">
<div class="col-lg-6">
<h3 class="fw-bold">Course statistics</h3>
<p class="small text-muted mb-0">Lorem ipsum dolor sit amet, consectetur adipisicing elit</p>
</div>
<div class="col-lg-6">
<!-- Example 3 -->
<canvas id="pieChart3"></canvas>
</div>
</div>
</div>
</div>
</div>
<div class="col-lg-6 mb-4">
<div class="card border-0 shadow-sm rounded">
<div class="card-body p-4">
<div class="row align-items-center">
<div class="col-lg-6">
<h3 class="fw-bold">Course statistics</h3>
<p class="small text-muted mb-0">Lorem ipsum dolor sit amet, consectetur adipisicing elit</p>
</div>
<div class="col-lg-6">
<!-- Example 4 -->
<canvas id="pieChart4"></canvas>
</div>
</div>
</div>
</div>
</div>
<div class="col-lg-6 mb-4">
<div class="card border-0 shadow-sm rounded">
<div class="card-body p-4">
<div class="row align-items-center">
<div class="col-lg-6">
<h3 class="fw-bold">Course statistics</h3>
<p class="small text-muted mb-0">Lorem ipsum dolor sit amet, consectetur adipisicing elit</p>
</div>
<div class="col-lg-6">
<!-- Example 5 -->
<canvas id="pieChart5"></canvas>
</div>
</div>
</div>
</div>
</div>
<div class="col-lg-6 mb-4">
<div class="card border-0 shadow-sm rounded">
<div class="card-body p-4">
<div class="row align-items-center">
<div class="col-lg-6">
<h3 class="fw-bold">Course statistics</h3>
<p class="small text-muted mb-0">Lorem ipsum dolor sit amet, consectetur adipisicing elit</p>
</div>
<div class="col-lg-6">
<!-- Example 6 -->
<canvas id="pieChart6"></canvas>
</div>
</div>
</div>
</div>
</div>
<div class="col-12">
<div class="card border-0 shadow-sm rounded" id="custom">
<div class="card-body p-5">
<div class="row align-items-center">
<div class="col-lg-6">
<h2 class="fw-bold">Customize your chart</h2>
<p class="text-muted mb-5 fst-italic">Lorem ipsum dolor sit amet, consectetur adipisicing elit, sed do eiusmod tempor incididunt ut labore et dolore magna aliqua.</p>
</div>
<div class="col-lg-6">
<!-- Example 7 -->
<div class="position-relative">
<canvas id="pieChart7"></canvas>
<div class="position-absolute position-center text-center pt-5">
<h1 class="fw-bold text-uppercase mb-0">$124k</h1>
<p class="text-muted text-uppercase mb-0">Toral expense</p>
</div>
</div>
</div>
</div>
</div>
</div>
</div>
</div>
</div>
</section>
</template>
<script>
//Bootstrap
import 'bootstrap/dist/css/bootstrap.min.css';
import './App.css';
import Chart from 'chart.js';
export default {
mounted(){
// MAKE ROUNDED EDGES FOR PIE CHARTS
Chart.defaults.RoundedDoughnut = Chart.helpers.clone(Chart.defaults.doughnut);
Chart.controllers.RoundedDoughnut = Chart.controllers.doughnut.extend({
draw: function(ease) {
var ctx = this.chart.ctx;
var easingDecimal = ease || 1;
var arcs = this.getMeta().data;
Chart.helpers.each(arcs, function(arc, i) {
arc.transition(easingDecimal).draw();
var pArc = arcs[i === 0 ? arcs.length - 1 : i - 1];
var pColor = pArc._view.backgroundColor;
var vm = arc._view;
var radius = (vm.outerRadius + vm.innerRadius) / 2;
var thickness = (vm.outerRadius - vm.innerRadius) / 2;
var startAngle = Math.PI - vm.startAngle - Math.PI / 2;
var angle = Math.PI - vm.endAngle - Math.PI / 2;
ctx.save();
ctx.translate(vm.x, vm.y);
ctx.fillStyle = i === 0 ? vm.backgroundColor : pColor;
ctx.beginPath();
ctx.arc(radius * Math.sin(startAngle), radius * Math.cos(startAngle), thickness, 0, 2 * Math.PI);
ctx.fill();
ctx.fillStyle = vm.backgroundColor;
ctx.beginPath();
ctx.arc(radius * Math.sin(angle), radius * Math.cos(angle), thickness, 0, 2 * Math.PI);
ctx.fill();
ctx.restore();
});
}
});
// EXAMPLE 1
var ctx1 = document.getElementById("pieChart1");
// eslint-disable-next-line no-unused-vars
var pieChart1 = new Chart(ctx1, {
type: 'RoundedDoughnut',
options: {
cutoutPercentage: 75,
legend: {
position: 'left',
labels: {
boxWidth: 10,
fontStyle: 'italic',
fontColor: '#aaa',
usePointStyle: true,
}
},
},
data: {
labels: [
"First",
"Second",
"Third",
"Fourth"
],
datasets: [
{
data: [250, 100, 100, 200],
borderWidth: 0,
backgroundColor: [
'#e63a54',
'#d8f4ff',
"#110f48",
"#f8f8fa"
],
hoverBackgroundColor: [
'#e63a54',
'#d8f4ff',
"#110f48",
"#f8f8fa"
]
}]
}
});
// EXAMPLE 2
var ctx2 = document.getElementById("pieChart2");
// eslint-disable-next-line no-unused-vars
var pieChart2 = new Chart(ctx2, {
type: 'pie',
options: {
legend: {
position: 'left',
labels: {
boxWidth: 10,
fontStyle: 'italic',
fontColor: '#aaa',
usePointStyle: true,
}
},
},
data: {
labels: [
"First",
"Second",
"Third",
"Fourth"
],
datasets: [
{
data: [300, 50, 100, 80],
borderWidth: 0,
backgroundColor: [
'#44b2d7',
"#59c2e6",
"#71d1f2",
"#96e5ff"
],
hoverBackgroundColor: [
'#44b2d7',
"#59c2e6",
"#71d1f2",
"#96e5ff"
]
}]
}
});
// EXAMPLE 3
var ctx3 = document.getElementById("pieChart3");
// eslint-disable-next-line no-unused-vars
var pieChart3 = new Chart(ctx3, {
type: 'pie',
options: {
legend: {
position: 'left',
labels: {
boxWidth: 10,
fontStyle: 'italic',
fontColor: '#aaa',
usePointStyle: true,
}
},
},
data: {
labels: [
"First",
"Second",
"Third"
],
datasets: [
{
data: [300, 50, 100],
borderWidth: 7,
backgroundColor: [
'#46d8d5',
"#182390",
"#f5e132",
],
hoverBackgroundColor: [
'#46d8d5',
"#182390",
"#f5e132",
]
}]
}
});
// EXAMPLE 4
var ctx4 = document.getElementById("pieChart4");
// eslint-disable-next-line no-unused-vars
var pieChart4 = new Chart(ctx4, {
type: 'RoundedDoughnut',
options: {
cutoutPercentage: 70,
legend: {
position: 'left',
labels: {
boxWidth: 10,
fontStyle: 'italic',
fontColor: '#aaa',
usePointStyle: true,
}
},
},
data: {
labels: [
"First",
"Second",
"Third",
"Fourth"
],
datasets: [
{
data: [250, 100, 100, 200],
borderWidth: 5,
backgroundColor: [
'#615dff',
'#ffb0d0',
"#ff8bb9",
"#f8f8fa"
],
hoverBackgroundColor: [
'#615dff',
'#ffb0d0',
"#ff8bb9",
"#f8f8fa"
]
}]
}
});
// EXAMPLE 5
var ctx5 = document.getElementById("pieChart5");
// eslint-disable-next-line no-unused-vars
var pieChart5 = new Chart(ctx5, {
type: 'pie',
options: {
cutoutPercentage: 50,
legend: {
position: 'left',
labels: {
boxWidth: 10,
fontStyle: 'italic',
fontColor: '#aaa',
usePointStyle: true,
}
},
},
data: {
labels: [
"First",
"Second",
],
datasets: [
{
data: [300, 50],
borderWidth: 2,
borderColor: [
'#46d8d5',
"#f5e132",
],
backgroundColor: [
'rgba(70, 215, 212, 0.22)',
"rgba(245, 225, 50, 0.23)",
],
hoverBackgroundColor: [
'#46d8d5',
"#f5e132",
]
}]
}
});
// EXAMPLE 6
var ctx6 = document.getElementById("pieChart6");
// eslint-disable-next-line no-unused-vars
var pieChart6 = new Chart(ctx6, {
type: 'pie',
options: {
rotation: -20,
cutoutPercentage: 10,
animation: {
animateScale: true,
},
legend: {
position: 'left',
borderAlign: 'inner',
labels: {
boxWidth: 10,
fontStyle: 'italic',
fontColor: '#aaa',
usePointStyle: true,
}
},
},
data: {
labels: [
"First",
"Second",
],
datasets: [
{
data: [300, 120],
borderWidth: 2,
backgroundColor: [
'rgba(70, 215, 212, 0.2)',
"rgba(245, 225, 50, 0.2)",
],
borderColor: [
'#46d8d5',
"#f5e132",
],
hoverBackgroundColor: [
'#46d8d5',
"#f5e132",
]
}]
}
});
// EXAMPLE 7
var ctx7 = document.getElementById("pieChart7").getContext('2d');
// eslint-disable-next-line no-unused-vars
var pieChart7 = new Chart(ctx7, {
type: 'RoundedDoughnut',
options: {
cutoutPercentage: 92,
borderAlign: 'center',
animation: {
duration: 2000,
easing: 'linear'
},
legend: {
position: 'top',
labels: {
padding: 10,
fontStyle: 'italic',
fontColor: '#333',
usePointStyle: true,
}
},
},
data: {
labels: [
"First",
"Second",
"Third",
"Fourth",
],
datasets: [
{
data: [120, 50, 80, 140],
borderWidth: 6,
borderColor: '#fff',
backgroundColor: [
'#f9d65c',
"#a9d876",
"#39be83",
"#0e8a73",
],
hoverBackgroundColor: [
'#f9d65c',
"#a9d876",
"#39be83",
"#0e8a73",
]
}]
},
});
},
}
</script>
4. In the end friends we need to add below code into our public/index.html file to get final output on web browser:
...
<head>
...
<link rel="stylesheet" href="https://stackpath.bootstrapcdn.com/font-awesome/4.7.0/css/font-awesome.min.css">
</head>
Now we are done friends also and If you have any kind of query or suggestion or any requirement then feel free to comment below.
Note: Friends, I just tell the basic setup and things, you can change the code according to your requirements. I will come with more demos.
I will appreciate that if you will tell your views for this post. Nothing matters if your views will be good or bad.
Jassa
Thanks
Leave a Reply
You must be logged in to post a comment.