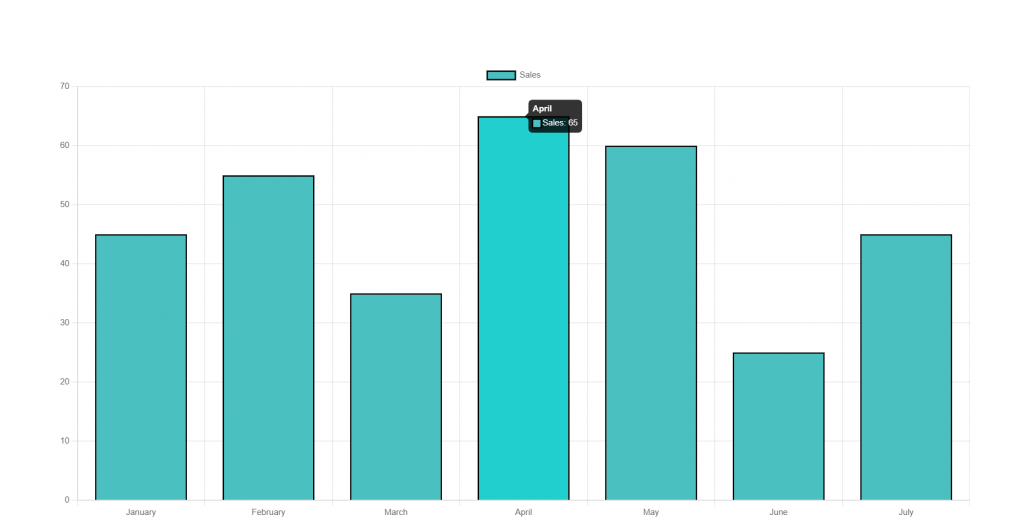
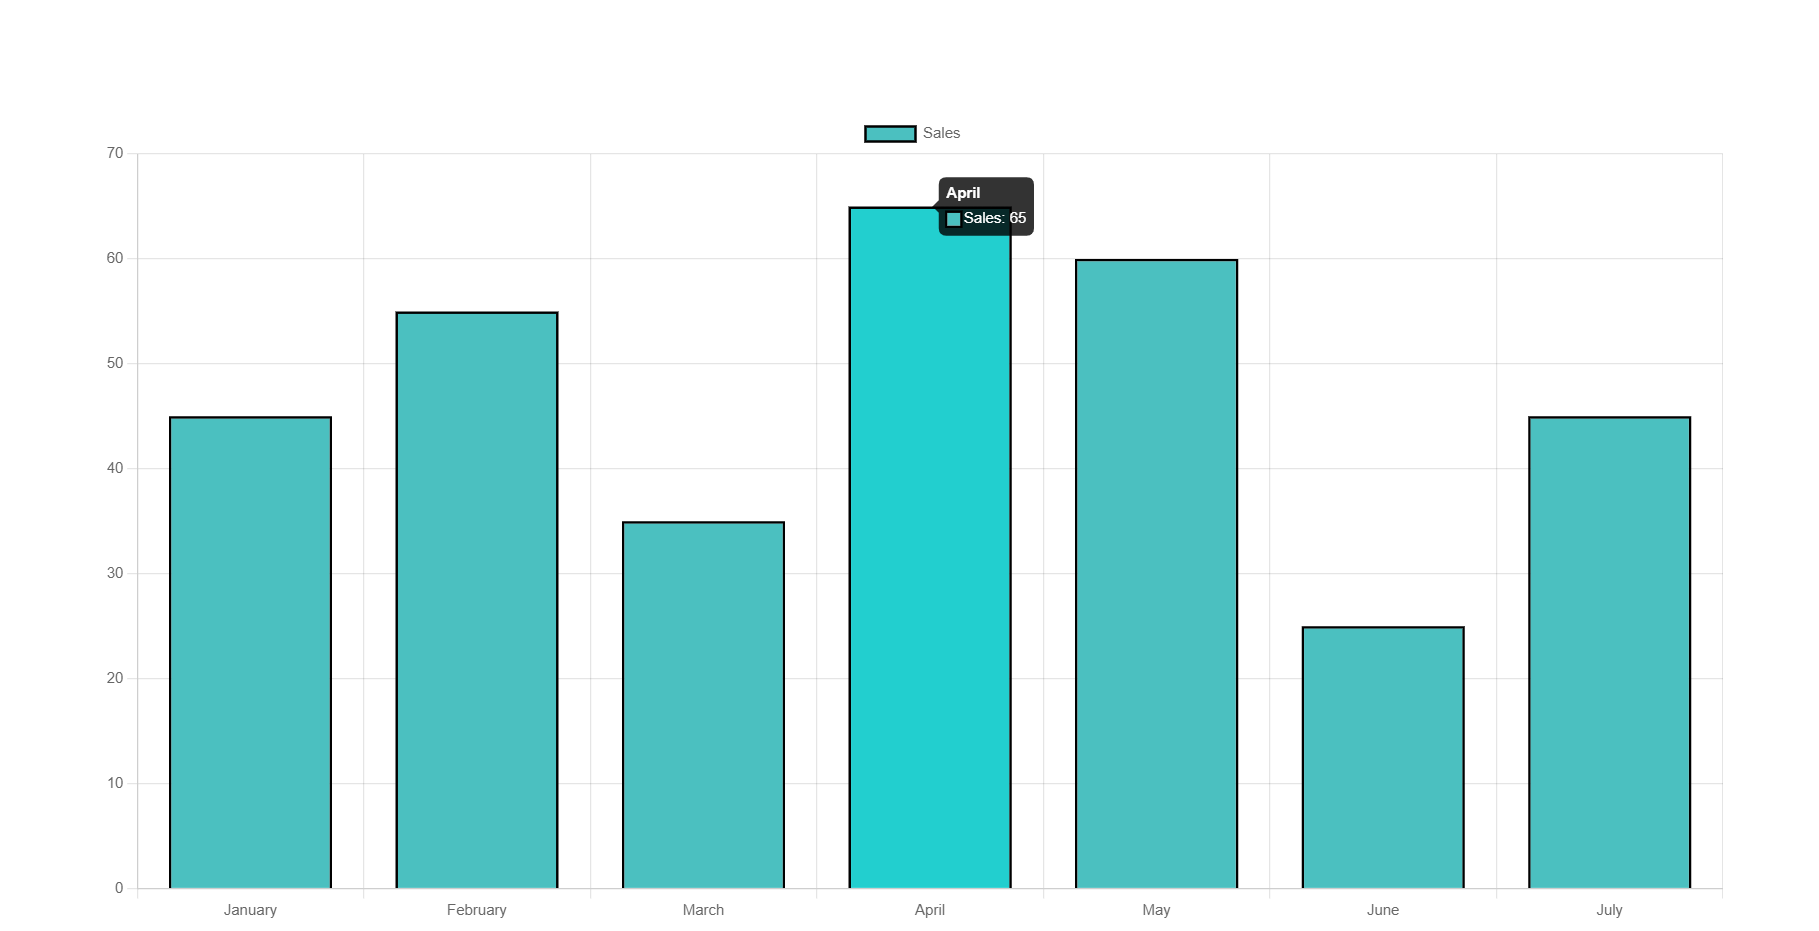
Hello friends, welcome back to my blog. Today in this blog post, I am going to show you, Reactjs Chartjs with Dynamic Data.

For reactjs new comers, please check the below link:
Friends now I proceed onwards and here is the working code snippet for Reactjs Chartjs with Dynamic Data and please use this carefully to avoid the mistakes:
1. Firstly, we need fresh reactjs setup and for that, we need to run below commands into out terminal and also we should have latest node version installed on our system:
npx create-react-app reactchart

cd reactchart
2. Now we need to run below commands into our project terminal to get chartjs and related modules into our reactjs application:
npm install --save react-chartjs-2

npm install chart.js --save

npm install axios

npm start //For start project
3. Finally for the main output, we need to add below code into our reactchart/src/App.js file or if you have fresh setup then you can replace reactchart/src/App.js file code with below code:
import React from 'react';
import {Bar} from 'react-chartjs-2';
import axios from 'axios';
class Home extends React.Component {
    constructor(props) {
        super(props)
          this.state = {
            months: [],
            sales:[]
                  }
          }

      componentDidMount(){
        //Get all chart details
        axios.get('http://localhost/chartjs.php').then(res =>
        {
        //Storing users detail in state array object
        this.setState({months: res.data[0]});
        this.setState({sales: res.data[1]});
           });


        }


  render() {

    return (

    <div className="maincontainer">


            <Bar
                data={{
                    labels: this.state.months,
                    datasets: [
                      {
                        label: 'Sales',
                        backgroundColor: 'rgba(75,192,192,1)',
                        borderColor: 'rgba(0,0,0,1)',
                        borderWidth: 2,
                        data: this.state.sales
                      }
                    ]
                  }}
                options={{
                    title:{
                    display:true,
                    text:'Average Rainfall per month',
                    fontSize:20
                    },
                    legend:{
                    display:true,
                    position:'right'
                    }
                }}
                />


    </div>


)
};
}

export default Home;
4. Guys here is my chartjs.php file data and this file is located inside xampp/htdocs folder::
<?php
header('Access-Control-Allow-Origin: *');
header('Content-Type: application/json');

  $months = array("January", "February", "March", "April", "May", "June", "July");
  $sales = array("45", "55", "35", "65", "60", "25", "45");
  echo json_encode(array($months,$sales));
  die();
?>
Now we are done friends. If you have any kind of query or suggestion or any requirement then feel free to comment below.
Note: Friends, I just tell the basic setup and things, you can change the code according to your requirements. For better understanding must watch video above.
I will appreciate that if you will tell your views for this post. Nothing matters if your views will be good or bad.
Jassa
Thanks

Leave a Reply
You must be logged in to post a comment.