Angular 8 chartjs working example

Β·

,
Angular 9, Angular 10

Hello to all, welcome to therichpost.com. In this post, I will tell you, Angular 8 chartjs working example.

Chartjs is very popular and very easy to use. On my blog, I have share many posts related to chartjs.

Now, I am using chartjs in angular 8 and in this I will static data but In my future posts, I will dynamic data from laravel 6.

chartjs-in-angular8
chartjs-in-angular8

Here is the working code snippet and please use this carefully:

1. Here are the basics commands, you need to use into your terminal or command prompt to install Angular 8 fresh set up:

$ npm install -g @angular/cli //Setup Angular8 atmosphere

$ ng new angular8chartjs //Install New Angular App

/**You need to update your Nodejs also for this verison**/

$ cd angular8chartjs //Go inside the Angular 8 Project

2. After Install Angular 8 fresh setup and go inside the Angular 8 setup, run below command into your terminal to install chartjs module:

npm install --save chart.js

3. After all above setup, here is code, you need to add into your app.component.ts file:

import { Component } from '@angular/core';
import * as Chart from 'chart.js'
@Component({
  selector: 'app-root',
  templateUrl: './app.component.html',
  styleUrls: ['./app.component.css']
})
export class AppComponent {
  title = 'angular8chartjs';
  canvas: any;
  ctx: any;
  ngAfterViewInit() {
    this.canvas = document.getElementById('myChart');
    this.ctx = this.canvas.getContext('2d');
    let myChart = new Chart(this.ctx, {
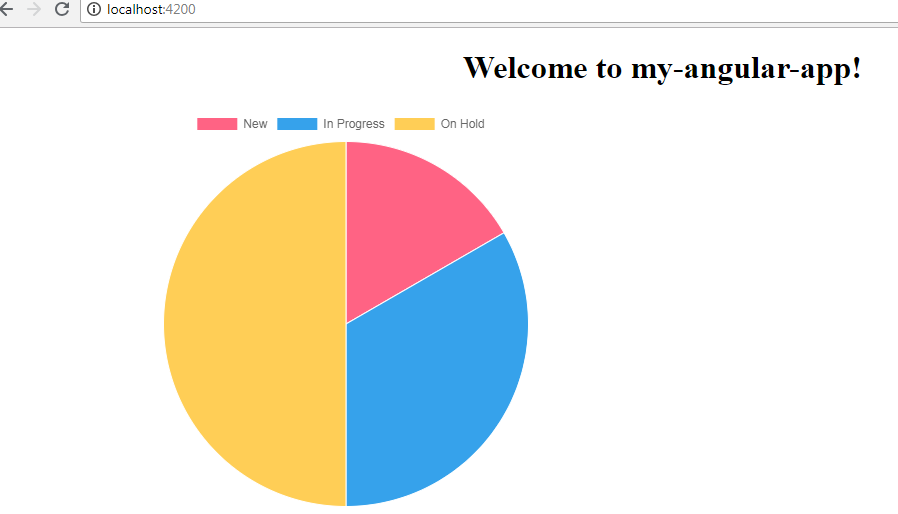
      type: 'pie',
      data: {
          labels: ["New", "In Progress", "On Hold"],
          datasets: [{
              label: '# of Votes',
              data: [1,2,3],
              backgroundColor: [
                  'rgba(255, 99, 132, 1)',
                  'rgba(54, 162, 235, 1)',
                  'rgba(255, 206, 86, 1)'
              ],
              borderWidth: 1
          }]
      },
      options: {
        responsive: false,
        display:true
      }
    });
  }
}

4. Now, add below code into your app.component.html file:

<canvas id="myChart" width="700" height="400"></canvas>

In this end, don’t forget to run ng serve command into your terminal and you will get this url localhost:4200

If you have any query related to this post, then please comment below.

jassa

Thank you

Comments

22 responses to “Angular 8 chartjs working example”

  1. Prashant Kumar Srivastava Avatar
    Prashant Kumar Srivastava

    Hi sir,

    I want to learn use of og tag in angular 7 project. And use its link for sharing on social networking sites.

    Thanks

  2. Ajay Malhotra Avatar

    Hello sir, it is related to seo or somethings, please explain more briefly.

  3. vinoth Avatar
    vinoth

    Hi Ajay ,
    This is vinoth
    Can you please post example with Grouped Bar chart using data REST api

    i have done the Chart but the data is not populating in Chart ,
    but i can see the Json in console .
    unable to read from that

  4. vinoth Avatar
    vinoth

    Hi Thank you so much.

    i have tried to draw the grouped bar chart , but its getting over lapping .

    export class AppComponent {
    title = ‘angular8chartjs’;
    canvas: any;
    data = [];
    chart = [];
    constructor(private http: HttpClient) {
    this.http.get(‘http://localhost:8080/report/adta?main_state=ALL&type=json’).subscribe(data => {
    this.data.push(data);
    console.log(this.data);
    this.canvas = document.getElementById(‘myChart’);
    this.chart = new Chart(‘canvas’, {
    type: ‘bar’,
    data: {
    labels: [this.data[0][‘year’]],
    datasets: [{
    label: ‘Count’,
    data: [this.data[0][‘type1’],
    this.data[0][‘type2’],
    this.data[0][‘type3’],
    this.data[0][‘type4’]],
    backgroundColor: [
    ‘rgba(255, 99, 132, 1)’,
    ‘rgba(54, 162, 235, 1)’,
    ‘rgba(255, 206, 86, 1)’
    ],
    borderWidth: 1
    }]
    },
    options: {
    responsive: false,
    display:true
    }
    });
    }, error => console.error(error));
    }
    }

  5. Ajay Malhotra Avatar
    Ajay Malhotra

    Which error you are getting?

  6. Julien Pitt Avatar
    Julien Pitt

    Thank you for this post.

  7. pratap singh Avatar
    pratap singh

    hello sir,How can we use waterfall charts instead of pie charts in angular?Thanks in advance.

  8. Ajay Malhotra Avatar

    Sure and I will share link soon.

  9. Rahul Avatar
    Rahul

    Where can I find your chart.js samples with external data like csv or json?

  10. Bapu Avatar
    Bapu

    Thank you. It is helped me.

  11. Lingesh Avatar
    Lingesh

    Hello Vijay…
    When we use the same code to bar chart the minimum data is getting nothing in Chart.. any help ? πŸ™‚

  12. Ajay Malhotra Avatar

    Will update you on this.

  13. Lingesh Avatar
    Lingesh

    Hello Ajay….. any help on this πŸ™‚

  14. Lingesh Avatar
    Lingesh

    Ajay… i Observed the issue that any one of displaying bar level minimum 15 else it does not display … how we can change the scale ( startup )..

    for example 5,6,15 is there is no issue… but 5,6,10 means the 5 is not getting display

  15. Ramachandran Avatar
    Ramachandran

    Hi,

    I’ve built a angular project sample with chart.js. The type of chart I’m working on is the vertical bar type chart.
    I’m currently able to generate the bar chart with appropriate data. I’m currently working on the tooltip style.
    I need your help in setting the code for tooltips caret pointing downwards.

    I found that using tooltip property ‘yAlign:”bottom”‘ will resolve my need while googling. However, using ‘yAlign’ property in my project throws error stating that ‘yAlign’ not a property in chart.js
    This is for your info that I’m using the chart .js version 2.7.2 and Angular 8+.

    Could you please guide me on this regards?

  16. Ajay Malhotra Avatar

    Okay sure, I will update you on this.

  17. kapil soni Avatar
    kapil soni

    Hi ajay i have tried ur solution and its working but after hover value will be undefined can you why i get undefined on hover?

  18. Ajay Malhotra Avatar

    are you getting data dynamic?