
Hello to all, welcome to therichpost.com. In this post, I will tell you, Angular 12 Chartjs Working Demo.
Angular12 came and if you are new then you must check below link:
Here is the code snippet and please use carefully:
1. Very first guys, here are common basics steps to add angular 12 application on your machine and also we must have latest nodejs version(14.17.0) installed for angular 12:
$ npm install -g @angular/cli

$ ng new angularcharts // Set Angular 11 Application on your pc

cd angularcharts // Go inside project folder
2. Now run below commands to set chartjs modules into our angular 12 application:
npm install angular2-chartjs
3. Now we will add below code into our angularcharts/src/app/app.module.ts file:
...
import { ChartModule } from 'angular2-chartjs';
@NgModule({
  ..
  imports: [
   ...
    ChartModule
  ],
4. Now we will add below code into our angularcharts/src/app/app.component.ts file:
...
export class AppComponent {
...
//line chart
type = 'line';
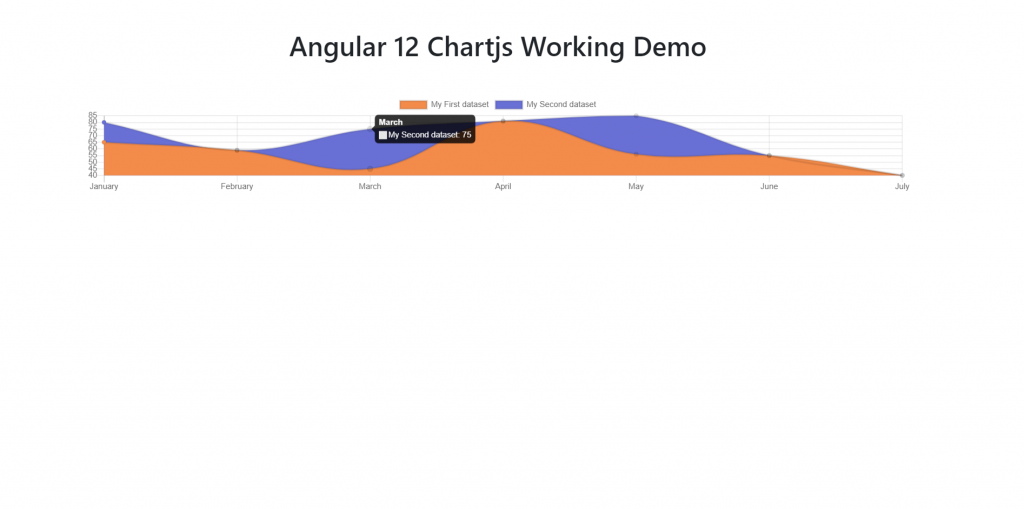
data = {
labels: ["January", "February", "March", "April", "May", "June", "July"],
datasets: [{
label: "My First dataset",
data: [65, 59, 45, 81, 56, 55, 40],
backgroundColor: ["#f38b4a"],
},{
label: "My Second dataset",
data: [80, 59, 75, 81, 85, 55, 40],
backgroundColor: ["#6970d5"],
}]
};
options = {
responsive: true,
maintainAspectRatio: false
};
}
5. Finally we will add below code into our angularcharts/src/app/app.component.html file:
<chart [type]="type" [data]="data" [options]="options"></chart>
Now we are done friends and please run ng serve command to check the output in browser(locahost:4200) and if you have any kind of query then please do comment below.
Note: Friends, I just tell the basic setup and things, you can change the code according to your requirements. For better understanding must watch video above.
I will appreciate that if you will tell your views for this post. Nothing matters if your views will be good or bad.
Jassa
Thanks
Leave a Reply
You must be logged in to post a comment.